Atlantic Menhaden Fisheries Management, or: The most important fish you’ve never heard of.

Authors note: This blog was written for FRE528: Environmental Economics and Policy 

I often find the best way to dig into a fisheries management policy is to start with two blank pieces of paper, one for a list of acronyms, the other for a jurisdiction flow chart. There’s nothing that bureaucrats love more than filling their documents with these codes, and wrapping your head around what they’re really talking about can be challenging, to say the least. So here’s the acronyms you’ll need for the next 1200 words:

ASMFC: Atlantic States Marine Fisheries Commission

FMP: Fisheries Management Plan

LEC: Law Enforcement Committee

MCS: Monitoring, Control and Surveillance

MSY: Maximum Sustainable Yield

NMFS: National Marine Fisheries Service

NOAA: National Oceanic and Atmospheric Administration

RFMC: Regional Fisheries Management Council

TAC: Total Allowable Catch

Whew, that’s a lot of jargon. Here’s the jurisdictional flow chart:

Jurisdictional flow chart for the management of Atlantic Menhaden


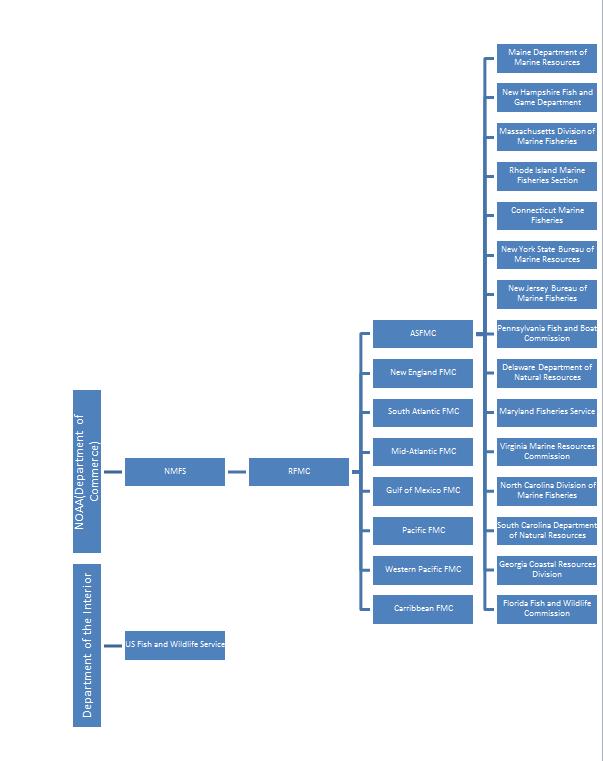
What’s important for understanding US fisheries policy is that there are lots of different national and state level departments either working together or at odds with each other and they’re all trying to manage these resources that do not stay within state lines, darn fishes! As President Obama mentioned in his 2011 State of the Union Address, “The Interior Department is in charge of salmon while they’re in fresh water, but the Commerce Department handles them when they’re in salt water,” the President continued with a classic dad-joke, “I hear it gets even more complicated once their smoked,” (which is probably true).

The reason why NOAA sits in the Department of Commerce and not in the Department of the Interior could be chalked up the role of marine fisheries in the economy, or the nature of shipping in ocean waters or even how important weather is to business, but really Nixon was just mad at the Secretary of the Interior when NOAA was formed in 1970, and so plopped it in Commerce.  And so it goes with much government management – often it is more based on personal relationships than any overarching political or economic theory.

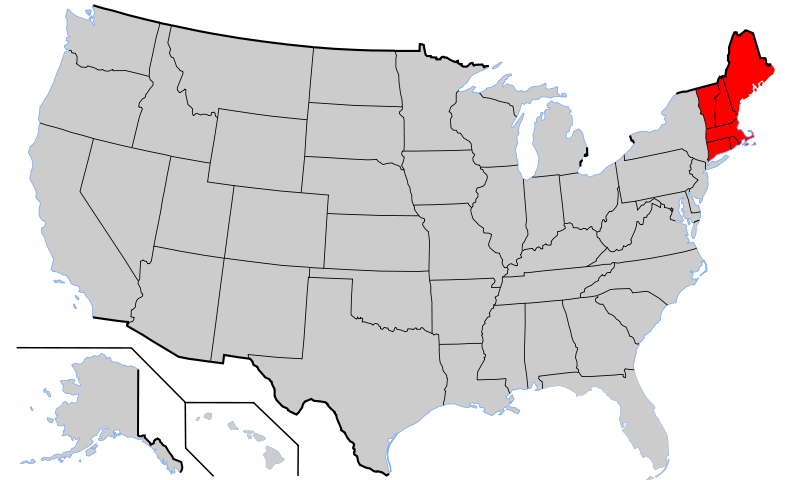
Within NOAA, there are lots of other departments, like the National Weather Service, the National Ocean Service and the National Geodetic Survey. The office that manages the nation’s fisheries is the appropriately named National Marine Fisheries Service (NMFS). NMFS does a lot of their own management and research, but a lot of the FMP’s are left to the RFMC’s (see, isn’t that acronym list coming in handy now?). There are eight RFMCs, the idea being that regional fisheries management can respond better to stakeholders needs. The RFMC that we’re slowly narrowing in on for this assignment is the ASMFC, made up of the 15 states of the Eastern seaboard. Each state commission’s three members to the ASMFC, and these individuals are then responsible for creating policy and managing the fisheries within these waters. But wait it’s not that simple- one of the three members is the head of the State marine fisheries agency, meaning that there is also a State agency overseeing these marine resources. Ah the complexity of representative government.

And so finally, at word 503, we get to introduce the star of this blog post, the Menhaden- one of the 25 species the ASMFC manages.

Small but mighty- the Menhaden might just be the most important fish in the sea.

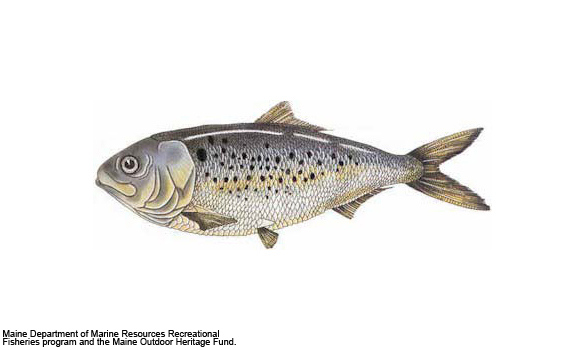
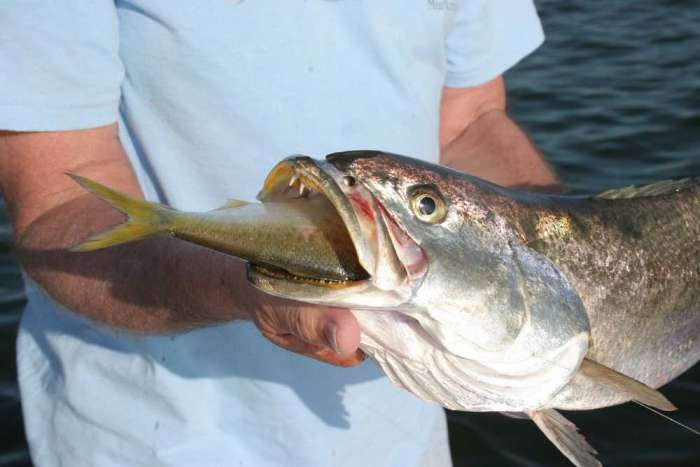
The Menhaden has always been one of my favorite fish, ever since reading Bruce Franklin’s wonderful book: “The Most Important Fish in the Sea: Menhaden and America.” They’re small fish, and they swim with their mouths gaped open, catching algae and phytoplankton as they swim. By doing this, one fish filters up to three gallons of water per minute, playing a crucial role in cleaning the water column. They are also the only forage fish in the Chesapeake and so they take the important role of keystone species, connecting the trophic levels between primary producers and tertiary consumers. Menhaden are important prey for fish we like to eat- like Stripped Bass- and also for birds we like to look at like Ospreys. We don’t eat menhaden; they’re quite smelly due to their high concentration of oil, but that oil makes them perfect for the Omega-3 fatty acid pills that Americans are so fond of. They’re also used for bait in other marine fisheries, both commercial and recreational, and they’re used for fertilizer and feed as fishmeal. All in all, menhaden make up the largest fishery on the East coast, and the second largest in the country (by volume).

nom nom nom- Menhaden make up the base of the Chesapeake Bay ecosystem (photo source: www.members.jacsonville.com)

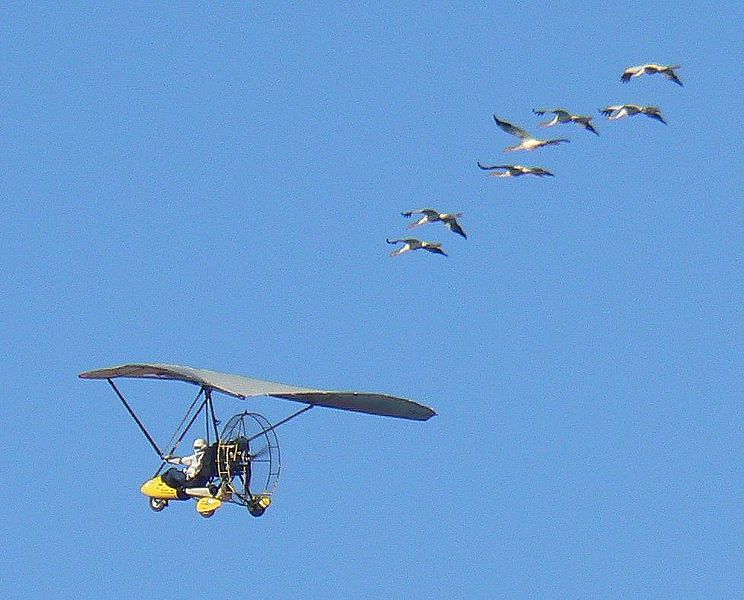
What is also amazing about this fishery is that there are only 8 boats involved, all owned by one company-Omega Protein (NYSE: OME). There is another menhaden fishery in the Gulf of Mexico which is larger, but still 90% of the vessels are owned by Omega. Omega vessels use purse seines which cause virtually no bycatch, and the company uses spotter planes to find large schools of menhaden close to the surface. Their incredibly efficient operation harvests 300,000-400,000 metric tons of menhaden annually.

Omega argues that they’ve been fishing menhaden for 100 years without any environmental problems, but scientists disagree. Recent stock assessments show that the population is at a record low, at less than 10% of the historic levels, and that while the stock is not classified as overfished, overfishing has occurred in 32 out of the past 54 years[1] (PEW Environment, 2014). The effects of the population decline are evident in the predators- striped bass, a $6.9 billion fishery in its own right, have shown signs of stress and malnutrition potentially due to the decline in menhaden (ibid).

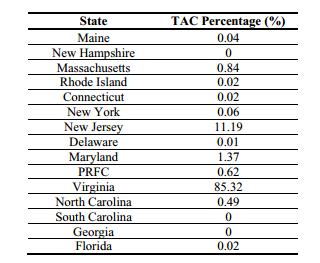
In response to concerns about the population, the ASMFC lowered the TAC in 2012 to 170,800 million tons, a 20% reduction of the 2011 catch (www.asmfc.org).  The TAC is allocated at the state level, and then states are required to close the fishery after their TAC has been fished. If the TAC is exceeded, the balance is removed from the next year of the state’s allocation. States are also allowed to trade or combine their TACs. But as you can see from the table below, most of the TAC is assigned to Virginia, not surprisingly, home of the Omega Protein factories.

The percentage of the TAC allotted to each state in the ASMFC by percentage. (Source: www.asmfc.org)

Enforcement is the state’s responsibility, and can be implemented through on board observers or general MCS of the fishery. The ASMFC has a Law Enforcement Committee (LEC) which is comprised of members of the NOAA Office of Law Enforcement, Coast Guard, and the US Fish and Wildlife Service.

To answer the final checkpoints- the advantages of a TAC is that it caps the amount of fish, and because there’s only one company the TAC does not incentivize increased effort by the fleet. There is no impact on discarding because the fishery has a low rate of bycatch. The TAC is effective in reducing the catch, but whether the reduction is enough to help restore the stock is still a question to be answered.

The menhaden is the most important fish you’ve never heard of, and its management structure outlines the complexity and bureaucracy (bureau-CRAZY) of national fisheries management. In the coming years, increased efforts to understand the ecosystem interactions of the fish will hopefully help to create a stronger, more sustainable management system- based in science and buoyed by economics.

References:

www.asmfc.org: Atlantic States Marine Fisheries Commission

www.chesapeakebay.noaa.gov

www.omegaprotein.com

Hank Shultz. Nutraingredients-usa.com. Dec 19, 2012 “Omega Protein’s Atlantic menhaden catch to be cut by 20%” http://www.nutraingredients-usa.com/Suppliers2/Omega-Protein-s-Atlantic-menhaden-catch-to-be-cut-by-20

Atlantic Menhaden Campaign. http://www.pewenvironment.org/campaigns/atlantic-menhaden-campaign/id/85899364506


[1] There’s also an important difference in the language used to describe fisheries- “overfished” means that the overall biomass of a stock is depleted, while “overfishing” occurs when annual fishing effort is greater than the MSY.


21. March 2014 by akagan
Categories: Conservation, Fisheries, management | Leave a comment

Seafood Traceability and GS1 Standards

Here’s my talk from the UBC Fisheries Centre on March 14, 2014

17. March 2014 by akagan
Categories: Fisheries, Seafood, Traceability | Leave a comment

CT and Climate Change Initiatives: Learning to love New England

My parents, after having lived in the midwest for 30+ years, uprooted and headed east in 2011. Now in Middletown, CT, my mom is the president of the community college while my dad is taking on a new role of house-husband after retiring from a long career as a professor. The midwest is notoriously freezing cold, terribly windy, and full of tornadoes, so moving to Connecticut seemed like a reprieve from those harsh winters and stormy summers.

How wrong they were. Within three months of moving into their new home, they went through two hurricanes and a tropical storm, one of which turned into an ice storm that took out the power for a week. It was a swift introduction to life in a coastal state in the midst of rapid climate change.

Connecticut, which is part of the region of New England, sits on the Long Island Sound, and is known for its wealthy coastline. Celebrity homes neighbor the water in some of the richest towns in America. But sea level rise, increased storms and more severe weather -all correlated with climate change- threaten the state and region. The New England states are relatively small- the whole of New England fits comfortably inside any one of the western states- so state level climate action would do little to affect the region’s total carbon emissions. Acknowledging this fact, the New England States along with a few of the Mid-Atlantic States (New York, New Jersey, Maryland, and Delaware) created the Regional Greenhouse Gas Initiative (RGGI, pronounced “Reggie”) in 2008.

New England, made up of Massachusetts, New Hampshire, Vermont, Maine, Connecticut, and Rhode Island, is home to just under 20% of the US population (about 50 million people), and produces about ⅕ of the US GDP (Hibbard et al., 2011).

RGGI is the first mandatory cap and trade system in the USA. The cap, set at 91 million tons of CO2 for 2014, applies only to fossil fuel power plants. Each year the cap is set to decline by 2.5% to further reduce emissions, keeping in step with the New England Governors’ Climate Change Action Plan. Emission permits are auctioned every three months, and the revenues are then invested into clean energy, energy efficiency, and consumer benefit projects (rggi.org, 2014)  

The initial impacts of the RGGI are just beginning to be seen, as 2009 was the first year emission allowances were auctioned. An analysis done by the creatively named Analysis Group found that the RGGI can be attributed with $1.6 billion in added economic value, including 16,000 jobs and $1.1 billion saved on energy bills (Hibbard et al., 2011).

Greenhouse Gas (GHG) emissions in the region fell by 6% in 2013, though how much of that decline can be attributed to RGGI is disputed (Volcovici, 2014). Simultaneous to the start of RGGI was the Great Recession, which decreased household spending, including on energy consumption. In addition, the price of natural gas has dropped dramatically due to the rise of hydraulic fracturing, which has caused some power plants to substitute to natural gas, independent of the carbon cap. Natural gas emits much less CO2, and so has had the overall effect of reducing the carbon emissions of the region.

To illustrate the impact of natural gas, just look at the cap set by RGGI in 2013 which was 165 million tons of CO2. At the end of the year, only 91 million tons had even been emitted, which depressed the price of the allowance and virtually eliminated the need for tradeable allowances (allowances have been auctioned within the range of $2-4/ton). In response to this, RGGI has now set the 2014 cap at 91 million tons, hoping to increase the trades of emission allowances.

In regards to the cost effectiveness of RGGI, we’ve discussed in class how costs are only minimized when the marginal cost of abatement is equal across all firms and/or individuals. Obviously, because RGGI is targeted only at power plants (25MW+), this assumption is not fulfilled. However because of the complexity of administering a cap and trade system, I think that RGGI is probably the most realistic version of cost effectiveness, in that it creates a system which could be expanded in the future to cover more parties. Cost effectiveness has to be concerned not only with total costs of abatement but also with total administrative and transaction costs as well. In a pioneering program like RGGI, it seems fair to target a subsection of the carbon economy to figure out how best to operate.

One of the decisions that RGGI made was to auction off emission permits, the idea being to overcome the windfall profits that were seen in Europe when permits were allocated for free. Because the states auction the permits, they collect revenue, which is then used to deal with the distributional effects of the cap and trade program.

When I went home for winter break, I was surprised that my parents had switched every single light bulb in the house, including in “my room” a.k.a. the cat’s living space. I couldn’t believe that they had done the work- it would be a huge undertaking to figure out every light bulb needed and spend the time replacing them and then responsibly disposing of the old ones. And it turned out I was right- they didn’t do it. The Connecticut Clean Energy Fund had sent a truck around the neighborhood and for a nominal fee they did an energy audit of our home and changed out all the lightbulbs, put weather guarding on the windows, and recommend the best times to run the washing machine (thanks to their advice my dad now starts the laundry at 4am to save money on the energy bill, which takes a certain…. dedication I suppose.)

Cat enjoys having her own energy efficient bedroom while the author attends Graduate School far away.

Overall the CT Clean Energy Fund has provided energy efficiency services to one million households and 7,700 businesses. This has saved 4.3 million tons of CO2 emissions within the state.

I would be remiss to not mention clean energy innovation, specifically because my bestie, Megan, just helped to launch the new Center for Clean Energy Innovation (CCEI) in Washington D.C. The CCEI is dedicated to encouraging innovation in clean energy technology by large scale investments in research and development at the State, National and International levels. Climate change, they offer, is an “innovation challenge,” which can’t be solved by carbon pricing alone. Using funds from RGGI auctions to invest in clean energy technology, in addition to efficiency and traditional renewable energy sources, could spur the New England economy forward, and make them a leader in innovative solutions to energy access.

There are also further questions to ask of RGGI: What will happen if energy usage increases as economic growth and employment continue to improve? How can we deal with the environmental impacts that fracking presents? Can RGGI be expanded to include other sectors of the carbon economy?

Despite the storms, my parents have grown to love their new CT home. They’ve removed any trees that threaten their power lines and they’ve bought a generator just in case. Global climate change threatens the coastal communities of the state and region, but through initiatives like RGGI and other programs at the state level, Connecticut could become a leader in climate change mitigation and adaptation.


References:

Hibbard, Paul, Susan Tierney, Andrea Okie, and Pavel Darling. The Economic Impacts of the Regional Greenhouse Gas Initiative on Ten Northeast and Mid-Atlantic States: Review of the Use of RGGI Auction Proceeds from the First Three-Year Compliance Period. Analysis Group; Economic, Financial and Strategy Consultants, 15 Nov. 2011. Web. 6 Mar. 2014. <http://www.analysisgroup.com/uploadedFiles/Publishing/Articles/Economic_Impact_RGGI_Report.pdf>.

“Regional Greenhouse Gas Initiative.” Www.rggi.org. N.p., n.d. Web. 6 Mar. 2014. <http://www.rggi.org/>.

Volcovici, Valerie. “U.S. Northeast Carbon Market Emissions.” Reuters. N.p., 5 Feb. 2014. Web. 6 Mar. 2014. <http://uk.reuters.com/article/2014/02/05/usa-energy-carbon-idUKL2N0LA1YB20140205>.

06. March 2014 by akagan
Categories: Climate Change | Leave a comment

Whooping Cranes and Adaptive Management

Authors note: This piece was written for my Environmental Policy Analysis class, the assignment asked about the costs and benefits of adaptive management.

I recently finished reading the book Wild Ones: A Sometimes Dismaying, Weirdly Reassuring Story About Looking at People Looking at Animals in America by Jon Mooallem. The book tells the story of three endangered animals in North America, the polar bear, the metalmark butterfly, and the whooping crane, and digs deeper into why and how we conserve these species.

Whooping cranes are listed as endangered, with only 382 individuals left in the wild.

For me, the book summarized a lot of what I’ve been recently feeling about conservation- to what end are we saving these species, at what cost, and for what purpose? The polar bear was picked not for its existence value but for its political value in the fight against climate change. The metalmark butterfly is bred in tanks in a lab and then released into a habitat that can no longer support it- having been ravaged by sand mining and environmental damage.

The whooping crane though is perhaps the most emotional and confusing character in the book. The butterfly is watched in the lab by tired undergrads earning bio101 credits, and the polar bear is an effort of NGO’s in Washington D.C., but the whooping crane has survived extinction primarily by the determination of a group of volunteers.

The whooping crane is an enormous white bird, standing five feet tall with a red crest and black tipped wings. Its natural habitat is central North America, from Alberta, Canada to Texas in the United States. Wild populations were estimated at 10,000+ birds, but by 1938 there were only fifteen animals left. The whooping crane was declared endangered in 1967, one of the first species to be protected by the Endangered Species Act. Conservation efforts have been successful in raising the wild population to 382 individuals, a 2400% increase, but the flock is still precarious.

The group that oversees the conservation of whooping cranes is the Whooping Crane Eastern Partnership (WCEP), which is made up of government agencies like U.S. Fish and Wildlife and the Wisconsin Department of Natural Resources, and also by NGOs like the International Crane Foundation and Operation Migration.

Operation Migration takes the most hands on role in the conservation of the cranes. In an effort to keep the birds “wild”, volunteers dress up in crane costumes while raising the chicks, never letting them around non-costumed humans. When ready for migration, the cranes are led by an ultralight plane from Wisconsin to Louisiana, over the course of three to four months. The intent is to teach the cranes the migration path so that someday they will successfully breed in the wild and continue to migrate without the involvement of humans.

A costumed volunteer interacts with juvenile whooping cranes in an effort to keep them “wild”.

So far, the cranes have not been very successful in breeding in the wild, often stepping on their own eggs or abandoning their nests. Further difficulties arise when hunters shoot the birds for sport, and minimal fines do nothing to deter the crime.[1] So Operation Migration and WCEP find themselves every fall leading a new group of juveniles on the migration path, and hoping that someday soon, they won’t need to anymore.

So how does this connect to adaptive management (AM)? Interestingly, there doesn’t seem to be a consensus regarding whether the management of the whooping crane fits under the AM umbrella or not. While the US Geological Survey (USGS) uses a photo of the cranes following an ultralight on their Adaptive Management webpage, an external review of WCEP states that “WCEP has not followed Adaptive Management practices”.

Operation Migration uses ultralight planes to lead whooping cranes on their migration path.

I chose the whooping crane for this question of “what are the theoretical costs and benefits of adaptive management, and what might hinder their implementation in practice?” because it offers a wide range of material for consideration and analysis, and a direct example of how and why AM should or should not be used.

On the one hand, the problem of whooping crane conservation was essentially at triage stage- without immediate and directed action the bird would be gone forever. On the other, an approach to the conservation management based on AM principles of scientific method could offer a more robust solution. Operation Migration, a group of ultralight enthusiast non-scientists are reported to “have a poor understanding of scientific methods and adaptive management,” but have also successfully kept the species alive.

As the immediate threat of extinction has receded, the political, scientific and social fractures have grown. Rifts both within and outside of WCEP have made the project more difficult each year. Successfully migrated cranes have been spotted in Wal-Mart parking lots eating garbage, much to the chagrin of conservationists- after all the work to keep these birds wild, they’ve ended up acting like pigeons. It brings up the question of why we are so dedicated to conserving these birds, what expectations we have of them, and what truly is wildness.

Adaptive management is based on the scientific method of question, hypothesis, prediction, implementation, analysis, updated hypothesis, and repeated implementation. How do these principles engage with the non-scientific community, and in instances of disaster? When a species is near extinction, is adaptive management really the best way to try to save it, or is immediate action better serving? Is preserving natural capital a right of the many or a privilege of the scientific community? Additionally who is liable for the loss of a species due to bad management, or credited for good management?

The costs of adaptive management are significant; it takes time to organize and conduct an AM plan, it takes dedicated staff and institutions to keep track of data and historical knowledge, it requires communication and cooperation amongst stakeholders and most importantly it requires the clear coordination of a common goal of management. Any one of these factors can lead to the failure of an AM project. As we’ve discussed in class previously, the designation of a clear and common goal, or even the agreement on what is truly the problem, can be a hurdle.

On the other hand, in my view, the benefits of AM are variable, dependent on the word “better”: better management, better outcomes, better knowledge of systems. It’s hard to quantify just how much better “better” is, and whether it is worth the challenge of dedicated AM practice.

In terms of the whooping crane, it does seem like the efforts of WCEP and Operation Migration have been successful, despite their formal scientific practice. Critics say that their “experience driven process neglects four critical steps of science: 1) forming questions and hypotheses about the situation; 2) making predictions based on expert opinion and current scientific knowledge; 3) collecting representative data; 4) conducting objective analyses of the data” (WCEP External Review, 2010). But they have also successfully created a dedicated community of whooping crane enthusiasts, who contribute time, money, and passion to the preservation of this species. Each year when the birds land in their destination, a crowd of people watch and celebrate the successful migration. AM doesn’t take into consideration social and cultural buy-in, or how to integrate conservation principles into public attitudes.

Overall, adaptive management seems recalls the idea that we must keep in mind the world we wish to live in, while working within the world we have. Ideally, management would be collaborative, adaptive, and inclusive. But likely more often than not, it is challenging, costly, and divisive. AM can be a goal but it also shouldn’t be restrictive- if a project is not employing AM, it should not be seen as contrary to good management. The scientific community should seek to advance AM thinking through public outreach and education, as well as collaborative projects with social and environmental organizations dedicated to improved outcomes of natural systems.


References:

Images sourced from wikimedia unless otherwise noted.

http://www.bringbackthecranes.org/whoweare/pdf/ExternalReviewMarch2010.pdf

www.operationmigration.org

http://www.usgs.gov/sdc/adaptive_mgmt.html

Mooallem, Jon. Wild Ones: A Sometimes Dismaying, Weirdly Reassuring Story about Looking at People Looking at Animals in America. New York: Penguin, 2013. Print.


[1] In 2011 an Indiana man shot “First Mom”, the first whooping crane to successfully mate in the wild and raise the chick to maturity. The man was convicted, and found guilty, but the fine was set at $1, hardly enough to deter others from doing the same.


02. March 2014 by akagan
Categories: adaptive management, Conservation, endangered species | Leave a comment

Conclusions and the Corn Palace

Well we made it through! I’m down 13% and ranked in the bottom five. But who cares, it’s over! right? right?

I didn’t trade this week, and as not trading and doing no market analysis is a sure fire way to get yourself landed in the bottom five, I might as well just lean in to it and write about something entirely different.

One thing I’ve been thinking about is how much I dislike technical analysis in the commodities market. If the idea is to set prices based on information from the world, then technical analysis shouldn’t be successful. How would a head and shoulders form exist if the market were acting appropriately in response to new information? It wouldn’t, unless somehow the world were providing information that would cause it, which I can’t imagine happens often enough for a name. It doesn’t make sense to me and I think it’s frustrating that food prices are being determined by dumb sounding charts like “dead cat bounce”, “cup and handle”, “Ascending wedge” etc etc. (The more I think about it the more these just sound like yoga poses).

So if I don’t like technical analysis, what can I use to assess market movement? I really like the idea of leading indicators. Mike talked briefly about the skirt hem indicator in 585 a few weeks ago- skirt hems go long during recession and shorter in times of economic growth. There are other indicators like this- the appalachian trail gets more through hikers when the economy is bad, and men buy more underwear when it’s good. But the one I want to talk about this week is the Corn Palace Indicator (I just made this up).

For those of you who don’t know about the Corn Palace, it’s the best place in the world. It was built in 1891 in Mitchell, South Dakota as a showcase of the fertile lands of the State. It’s been rebuilt 3 times (turns out building things made out of corn is slightly flammable), and also the Palace has a mascot, obviously named CORNELIUS! Every year they cover the Palace in murals made from ears of corn, which all relate to a common theme (if you’ve ever seen the movie Drop Dead Gorgeous, then some of these themes will sound strikingly familiar- “American Pride” (2011), “Salute to Youth Activities” (2012), “Everyday Heros” (2008).)

Corn Art

While I didn’t grow up on a farm, I did grow up in the midwest. Minnesota is one of the largest producers of corn, and obviously South Dakota is right up there as well. My godparents live in Mitchell so we’d make the drive out there at least three times a year. Also they lived four blocks away from the Corn Palace. I was a huge fan (I am a huge fan).

For anyone who wants to check it out, there’s also a livefeed (THIS IS NOT A JOKE) of the Corn Palace.

The author, age 17, at the Mitchell Corn Palace

So how does this relate to economics and commodity markets? Well the Corn Palace uses a lot of corn. And in 2007, the drought in the midwest was so bad, the Corn Palace couldn’t replace their murals for the first time since 1892. Just last year, the number of corn varietals ready at harvest for the Palace was nearly halved, again by severe drought. Steven Colbert, covering the story for The Colbert Report said, “We’ve been warned about rising food and fuel prices. But no one prepared us for less vibrant corn murals.”

And it’s true. The local news each year about the Corn Palace murals reflects the overall harvest in the Midwest. A good year means a good Palace. As the impact of climate change continues to grow, I’m worried we’ll be seeing more extreme weather events, and fewer corn murals. The already volatile commodities markets will probably increase in volatility as we lose our predictive capabilities due to climate change. And as I mentioned in my previous post- that will have a more widespread effect on the world than just the Corn Palace designs.

So that’s all folks, I’ve lost a lot of fake money in this fake trading game, but I’ve learned a lot too. Also, I’ll continue to use this blog for analysis throughout the year, so check in from time to time, if you’d like.

24. October 2013 by akagan
Categories: Climate Change, Corn Palace, Futures game | 1 comment

WTF is a “dead cat bounce” and further issues

“Bigger dead cat bounce expected today” reads the headline on Agriculture.com today, continuing: “For those of us watching the ‘dead cat bounce‘ for a clue as to when to sell, it has been a crazy world the past couple of weeks. If you are confused by market action, do not feel alone.”

Luckily this is what came up when I googled “Dead Cat.” Thanks internet!

But don’t worry, dead cat bounce is just one of the many strange terms in technical analysis. It refers to a temporary respite in a downward trend, followed by a return to a downward trend. Why dead cat? Why not dead bunny or dead gerbil or even something not dead? I don’t know, but it probably has something to do with finance being controlled by men in their 20’s.

What you get when you google “dead cat bounce”

But let’s move on from dead cats, please. This week, the US government came back to life, with President Obama signing the funding bill close to midnight on Tuesday. My plan to hold all my long positions in hopes that the gov’t reopen would shoot prices up up and away failed to materialize when the grain exchange decided they still do not care about the government.

Apparently corn doesn’t care about the government.

So my grand plan to simply ignore my portfolio didn’t really work out, and I’m still negative, although wheat is pulling back out of the red at least.

My portfolio as of Oct 17

But I’d like to switch gears a bit. We’re currently at the midpoint of our semester, and we’re nearing the end of this trading game. And I’d like to ask: Why are we all struggling so much to make money? How does the market set prices if it’s not due to actual information? A paper in the Journal of Agricultural Economics from 2012 entitled “How to Understand High Food Prices”  contends that speculators in the commodities market drive prices without any inherent justification. In fact, the paper goes as far as to say that speculators actually played a bigger role in the 2008 food crisis than actual food shortages or increased demand from biofuel. So this has gotten me thinking, are speculators making the world better, or worse? And what responsibility do we have, as budding agricultural economists, to criticize a system that makes it harder for people to afford food?

That is the thing that has been missing most obviously in any of our discussions of futures markets- consumers. And not consumers like us where we just go to the market and buy some cereal or bread and it’s fine, but consumers at the margins- those living off $2 a day or less- or even the 30 million Americans who are food insecure. When the price of corn futures spikes up, what does that actually mean? Not just for our portfolios but for the people who are unsure if they can afford food tomorrow?

Is this spike really caused by food shortages, or was it the markets’ herd mentality?

I think we’ve gotten the point of the game- futures prices are volatile and are affected by current events as well as other exogenous factors- but it’s time to start talking about whether or not it’s a good thing, and what the big picture purpose is.

Perhaps a more likely scenario than we’d want to believe.


18. October 2013 by akagan
Categories: Futures game | 2 comments

A lack of information

After last week’s guest speaker, who told us he rarely leaves his trading desk for more than 5 minutes at a time, I was feeling pretty stuck in my -11% portfolio return. I have the time to check my stocktrak about twice a day, if I remember, and I’ll check the market for the day but probably won’t take the time to really assess, analyze, and then forecast what is coming along. And that’s in a week without the dreaded 501 assignment 2, which sucked the life out of me over tuesday, wednesday, and thursday. By the end of wednesday night, having spent 5 hours trying to figure out the error in my model, I collapsed into a pile of goo and binged on episodes of Scandal.

But all things considered, this was probably the best week to ignore stocktrak- the market barely moved and I maintained my ranking of 20/26 in our game. Nothing huge really happened this week, and because the US Gov’t is still shutdown (day 11), there isn’t much new information for traders to use anyways. 

That is, until this morning, when a leaked EPA report swung prices DOWN DOWN DOWN! While the EPA remains shuttered, somehow a report which proposed lowering the biofuel mandate levels made it to the newsroom. Decreased mandates would mean a huge reduction in the demand for corn within the US, and the markets reflected this news by closing corn at the lowest it’s been in three years. GOOD THING I BOUGHT CORN LAST WEEK. I’m out $2000.

Corn futures over the past year

I think, like others, I’ve learned that trading in commodities is a crap shoot and that there’s very little that strategy can do to ensure profits. But I have learned a lot about the market and how these systems function. I guess my point is that this blog post doesn’t have much about my trades because for now I’m just holding my portfolio and watching as it changes, or doesn’t day to day.

Of course, on monday the next crop report is due, and with no gov’t deal on the horizon, we probably won’t be seeing that. The debt default date is also impending, further adding to the uncertainty and unpredictability of the markets.

I’m off to the mountains for the weekend, hope everyone has a great thanksgiving!

11. October 2013 by akagan
Categories: Futures game, Government Shutdown | Leave a comment

Shutdown and homesickness

What to say about this week. While my portfolio continues to perform horrendously  (-11%), I’m finding it difficult to get motivated to do anything about it. I’m somewhat confident that this week’s slump will recover at some point, although who knows. I haven’t been keeping up very well with the markets this week, as most of my attention has been turned towards the US government shutdown.

It’s hard to get data on US agriculture when the USDA is shutdown.

On Monday at midnight, the US federal government shutdown, and continues to be through today at least (Friday) if not further. The “debate” that caused the shutdown regards a standing law, the affordable healthcare act (obamacare), and a faction of the Republican party which is acting like a small child. For more detailed analysis, I highly recommend this week’s Daily Show coverage.


But what’s most interesting, in regards to this futures game, is that the shutdown hasn’t seemed to affect the markets AT ALL! As of right now, the markets are actually going UP! An interview on APM’s Marketplace podcast with a Wall Street employee actually said that it’s become like the story of the Boy Who Cried Wolf- so much so that the markets aren’t even responding.  Of course they might become more wary as we approach October 17- when the US treasury runs out of money and can no longer pay the debt….. hopefully the Government is up and running by then, but again, who knows! I think it’s interesting to look at the US political system in terms of what Prof. Johnson was talking about with forecasting- the US congress is probably the least easy variable to model, and one of the most impactful. The less businesses know about Obamacare for example, the less they are able to plan for their next move, meaning bad planning meaning bad decisions.


So I have decided to simply hold my current positions- I’ve gone long on all the December/Nov contracts, and to hedge that a bit, I’ve gone short on some January/March contracts. It doesn’t seem to be doing much, as my holdings are continuing to decline.

The homesickness part of this post is about how in the light of the shutdown, I’ve been missing living in DC. DC is a hilarious city full of 20-somethings who have too much responsibility. I love how seriously everyone takes themselves there. The monotonous and ubiquitous black trench coats with slacks from The Loft come out in the fall weather. And of course, the complete over obsession with the national news about Washington. Washingtonians hate/love news about Washington. As the shutdown became a reality, bars throughout DC started offering all day happy hour specials to federal employees, apparently Netflix stock went through the roof as people guessed (probably correctly) that furloughed employees would be leaning in to some binge watching of Scandal or Orange in the New Black.


It’s easy to feel far away here in Vancouver- three hours behind my family and friends and the national news. But at least my Netflix subscription works here.

04. October 2013 by akagan
Categories: Futures game, Government Shutdown | 1 comment

Week two, what’s going on?

So week one, it turns out, was the easy one. Clear news events (i.e. the crop report and the fed news) made trading decisions and market fluctuations fairly clear (despite the fact that I did not read the signals correctly, and lost money). Week two is shaping up to be much more opaque. Corn was down, soy was up, then corn was up, and wheat shot through the roof! In a scramble, I covered my two shorted positions on wheat and corn, but not before losing thousands of dollars, and then bought corn and wheat in an effort to recoup just in time for the markets to slow, and I ended up losing money again! I have no idea whats happening! Here’s where I stand:

Two long contracts on wheat that are FINALLY getting me a return (.07%!!!!)

Two long contracts on corn that are still losing money, don’t ask me why (-.33%)

Three long contracts on soy that I thought were a good idea, but am being proved wrong by the hour (-.41%)

Overall I’ve now lost $2,473. Ouch.

Honestly, I haven’t been very on top of the market this week. But at the very least, I seem to be in good company.

“…for row crops, movements are proving less easy to predict, with corn, for instance, opening the last session firm, but ending strongly lower without any apparent fundamental justification.” says agrimoney.com of this week’s market movements.

So within the insanity, I’ve decided to settle in with my current trades and just see what happens. Part of this decision is due to frustrations, specifically:

a) The time delay in trading: As I watched corn prices on the rise this morning at 8:30, I quickly jumped to stocktrak and tried to jump on for at least a day trade gain. By 10:45 my trade still hadn’t gone through, for whatever reason, and the prices had declined. By the time the trade went through, I was again, losing money. Not so fun.

Goodbye money! Bon voyage!

b) Similarly, I tried to buy corn while holding a short position on corn simultaneously. This made sense to me- I could buy corn for the day and sell it later to make a quick profit, but hold my short position in the long run if corn were to decline in price later in the week/month/year/era. However stocktrak doesn’t let you hold a short and a long position on the same commodity. Is this true in the markets? I feel like it shouldn’t be. So sadly, I covered my corn to be able to buy it, and as explained above, lost money anyways.

While I don’t know much about what’s happening this week, there are some things coming around the bend:

1) Monday is the last day of the month and is also the day that the USDA releases the next crop report. There should be lots of activity as funds try to balance their books for Oct 1 and also in reaction to the next report. Which way that activity goes is anyone’s guess.

2) Frost in Argentina, wheat shortage in Russia, floods in China, and drought in Brazil. I’ve been reading articles about all these scenarios and what their impacts will have on commodity prices. The consensus is that no one knows. So, helpful.

3) US Government Shutdown looms on October 1st. The markets in the past have reacted strongly to scares of shutdowns, although the last time this happened, the markets pretty much ignored it (boy who cried wolf; Cruz who cried Obamacare). So while my friends in D.C. are planning their vacations for next week (Federal employees are not allowed to work in the case of a government shutdown), I’m watching the corn charts. Somehow I feel like I got the short end of the stick.

After releasing their crop report on Monday, these federal employees might be able to enjoy some mandated vacation! Thanks Congress!

Primary feeling of the week: The Trend is Your Friend is a terrible rule, unless of course, it’s not.

FINAL THOUGHTS: As we enter October, and fall is officially upon us, I encourage everyone to lean in to pumpkin spice lattes, apple scented candles, and watching reruns of Hocus Pocus and Nightmare Before Christmas.  As Jack Skellington asks, “Something’s here I cannot see! What Does it Mean, What Does it Mean!” Very relevant this week!

Jack Skellington

25. September 2013 by akagan
Categories: Confusion, Futures game | 1 comment

The Fed, Corn and Soy

Welcome to the first week of trading. So far, I’ve bought soy, shorted corn, and then on a whim bought wheat. Last night when I checked, I had earned $33- however this morning, to my dismay, I saw that my portfolio had lost over $700. Trying to avoid a tiny heart attack (mostly by reminding myself that this is fake money), I went to find answers.

The big event this week was the US Federal Reserve’s press conference at 2pm EST on Wednesday. Nearly everyone thought that the Fed would finally begin the process of tapering interest rates back up, after being held at nearly zero for years in an effort to stimulate economic growth. So when Ben Bernanke announced that they would NOT be raising interest rates, the markets when nuts.

Wednesday’s surprising headline

The S&P500 gained nearly 20 points in just minutes after the announcement was made.

The impact of the Fed’s announcement on the S&P500

Despite corn’s downward trend following last week’s crop report (a bumper crop pushed prices down), the dramatic upswing of the market took corn futures with it. This is probably where my $700 went.

The impact of the Fed’s Announcement on Corn Futures

So why did the Fed do what it did? I would point to two non-economic issues driving the decision.

1. The American Congress. Congress is supposed to create and manage fiscal policy to ensure that the economy stays stable-ideally, with an upward trend. Fiscal policy is intended to check-and-balance monetary policy, which is of course directed by the Federal Reserve. Because Congress has been unable to fulfill any of their responsibilities since 2008 (probably longer, but definitely since 2008) due to partisan bickering and obstructionist politics, the US has been relying almost entirely on the Federal Reserve to maintain the small amount of economic growth we are seeing. Because of this responsibility, a responsibility that the Fed really isn’t intended to have, Bernanke has been very conservative in making any large changes to monetary policy that could shake the little confidence that the American economy has right now. Without robust fiscal policy to compliment them, the Fed is doing everything it can to maintain stability and trust in the American dollar and economy, namely by keeping interest rates low and by pushing money into the economy- aka quantitative easing.

2. Bye-bye Bernanke. After almost 8 years as the Head of the Fed, Bernanke will be stepping aside this year. Because of the already unstable economic recovery, paired with the additional responsibilities the Fed has had to assume because of the partisan congress, I think the Fed is aware that any change in leadership is going to inevitably shake the morale of the American people, and the world. Up until this week, most people assumed that the next Head of the Fed would be Larry Summers. But Summers pulled his name from the short list, leaving many wondering who would be the next at the helm. The next obvious front runner after Summers is Janet Yellen. Currently the Fed Vice-Chair, Yellen has a strong background in economic and monetary policy. She would also be the first chairwoman of the Fed, a fact which has some neanderthal political commentators concerned- will she be strong enough, authoritative enough to run the Fed etc. So in the face of this leadership transition, it seems appropriate that the Fed would choose to remain at current interest rates and not introduce any new policy changes.

So for these reasons, plus probably many more, I’m out $700. At least for now. We’ll see what happens next week!


Resources I’m finding useful in my research:

Marketplace: A daily podcast by American Public Media which discusses news from Wall Street and the greater economy in a fun and interesting way. Solid analysis that’s easy to listen to. Also post their stories online.

New York Times Business: Hourly charts of stocks, bonds, and commodities which are easy to read and compare. General data on soy and wheat with more detailed info on corn.


19. September 2013 by akagan
Categories: Futures game, The Fed | 1 comment

← Older posts

Spam prevention powered by Akismet