Introduction to Bias
For this example, let’s focus on gender bias in the workplace.
Note!
In our simulation, for simplicity, we make a few core assumptions:
-
-
- We are only considering one aspect of a person’s identity* at a time
- We only consider how two groups interact (i.e. men and women), knowing that identities are rarely expressed as binaries and acknowledging that more than two genders exist
- Men and women are equally likely to show bias
- Bias has the same costs for men and women
- We focus on interpersonal bias (i.e., bias that happens between two people), even though it can occur on individual & institutional levels as well
-
*People hold multiple identities at the same time (see intersectionality), our simulator only portrays bias based on one aspect of an individual’s identity; in reality it is rare for individuals to only display one aspect when interacting with others
Wait, what counts as a gender-biased interaction?
Gender bias in the workplace can look like:
- Making a demeaning joke about women in front of colleagues
- Asking a nonbinary co-worker to sit out of a key meeting with a client due to their gender
- Uneven dress code expectations for women
Same-gender bias can also exist, however here we are focused on cross-gender bias.
Bias can be explicit or subtle, and research demonstrates that it exists in many forms.
<<insert icon>>Women researchers need to publish more articles in journals than men to be seen as equally competent.(Wennerås, & Wold, 1997) |
<<insert icon>>Gendered language can negatively affect how attractive job descriptions are for prospective candidates.(Gaucher, Friesen, & Kay, 2011; He & Kang 2022) |
<<insert icon>>A study of hundreds of interactions (e.g. door holding, asking for directions) found that 5-25% of participants treated members of marginalized groups (racial, ethnic, or sexual orientation) more negatively than those in the advantaged group.(Campbell & Brauer 2021) |
<<insert icon>>Job applicants with more Anglicized names had more favorable pre-interview impressions (initial reactions based on reading a resume & a senior personnel’s positive rating of the candidate) than other candidates.(Watson, Appiah, & Thornton, 2011) |
Both the explicit and subtle forms of bias highlighted above make people feel less included in a group, especially for those who are underrepresented.
To illustrate this over time, let’s turn to our workplace simulation.
Let’s get to know our workplace
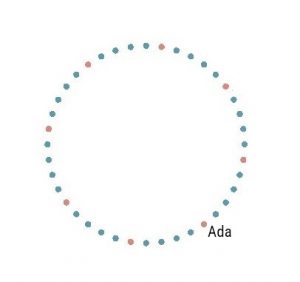 |
Ada works in an office of 40 staff.
To visualize Ada’s workplace, each individual is represented as a circle, blue for men, and orange for women. This group of circles can also be called a network. Ada’s company of 40 people is 20% women (similar to many STEM companies in North America) – 8 women, 32 men. |
Interactions appear as arrows. In our simulator, we demonstrate neutral interactions by using a gray arrow and biased interactions by using a red arrow.
| So if Mariana asks for Rajesh’s advice on a project (neutral interaction) it would look like this. |  |
|
Or, if Ben says a gender-biased comment to Mei (biased interaction) it would look like this. Biased interactions reduce inclusion, so they push the targeted individual out of the network. |
 |
Remember Assumption #3: each group is equally likely to show bias. We’ll assume in this round of the simulation that 1 in 4 interactions are gender biased.
With the same number of men and women, average interactions would look like this:

But what happens when there is not an even number of people in both groups?
Compounding Biases
As you saw earlier, Ada’s company of 40 people is 20% women, making the number of men and women in this company unequal.
How do you think Ada and her women co-workers will experience bias?
In our simulator, each person will have 3 interactions with randomly chosen people, visualized using arrows.
Use the Control Panel to Interact with the Simulation
 |
|
Use the Inclusion Graph to Monitor Inclusion Levels
 |
The graph helps us keep track of the inclusion levels of men and women respectively, representing feeling included, and the negative numbers indicating lower levels of feeling included in the network.
Visually, the dots that do not move out of the circle have not experienced gender bias in these interactions |
here is me trying the project RISE simulator
here is me trying the project RISE site generally
here is me trying the ESS site generally
Try It Out
Run the simulation a few times and see what happens.

Why is women’s inclusion lower than men’s in this simulation?
Introducing the Petrie Multiplier
British computer scientist, Karen Petrie, developed a mathematical model called the Petrie Multiplier, which we use in our simulator.
This model states that even when two groups have the same likelihood of enacting bias on each other, the underrepresented (smaller) group experiences disproportionate impact
In other words, simply being in a minority group has a disproportionate impact on sense of inclusion. So what can we do about this?
A Moment with Ada
“My coworker was telling me that she was thinking of quitting after hearing the same sexist jokes over and over in the office…”
 Follow