Ada and Ben
Ada works on a project team with her coworkers Imani (she/her), Hong (he/him), Mark (he/him), Ben (he/him), and Rajesh (he/him).

Ada and Ben, another civil engineer at the company, interact regularly on a project.
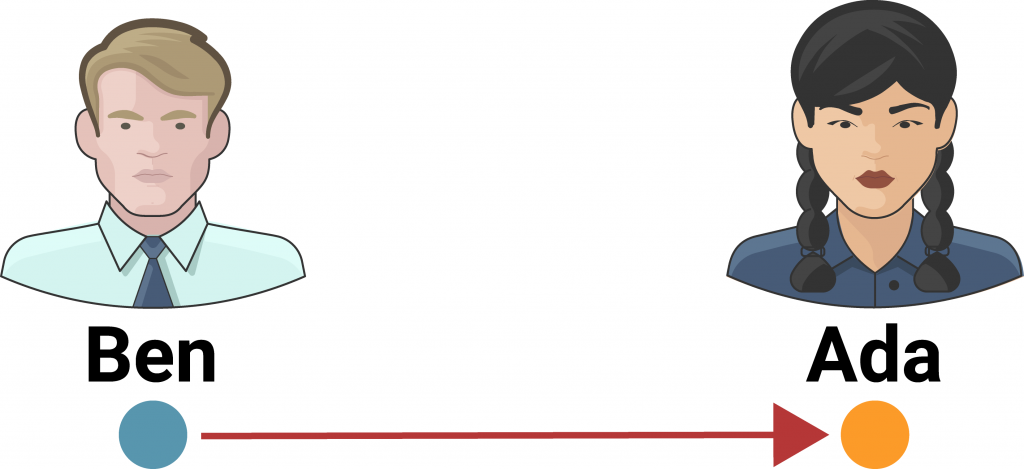
Sometimes, their interactions are neutral. For example, Ada might ask for Ben’s feedback on a project mockup.
“I changed this part of the design, what do you think?”
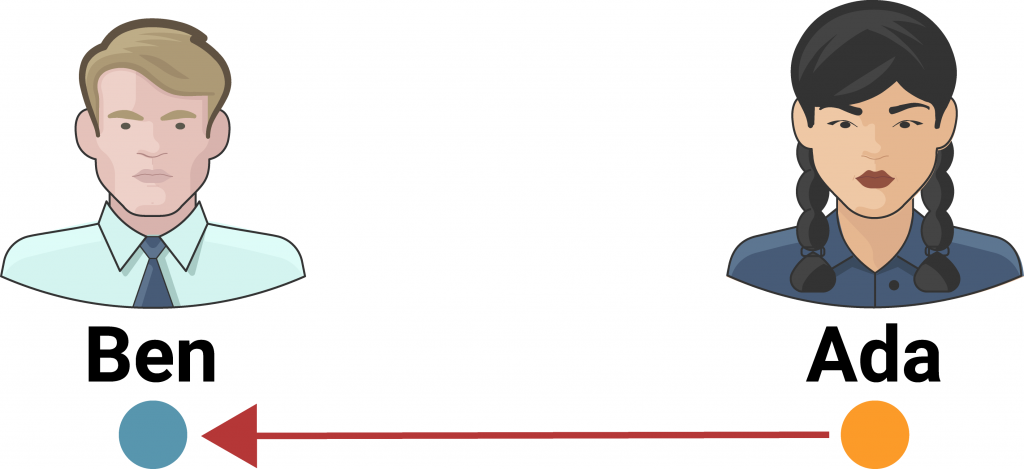
At times, their interactions are affected by gender bias. For example, Ben might suggest that Ada take notes during a meeting while he leads the client talks.
“Can you take notes? Yours are the best out of anyone’s, and I’m leading the meeting.”
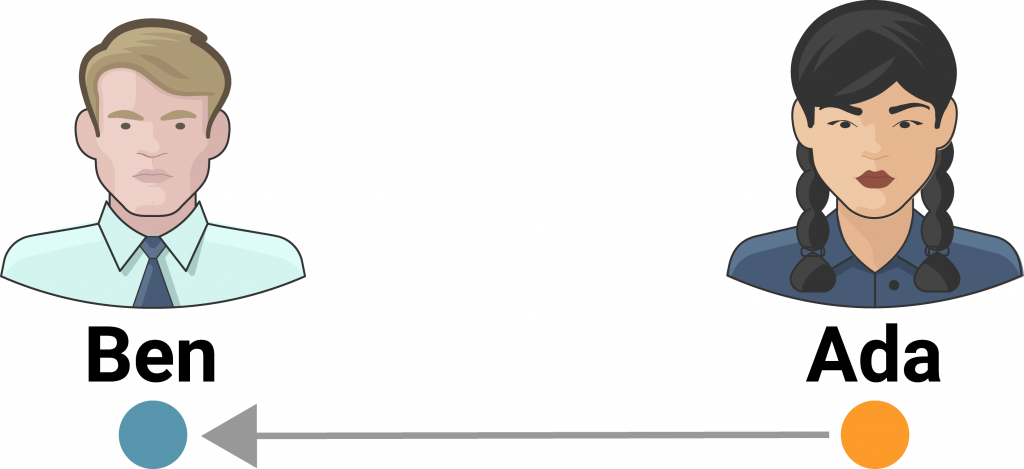
Or Ada might say that Ben wasn’t acting tough enough during a difficult client negotiation.
“You weren’t tough enough in that negotiation!”
How do these interactions play out in the larger workplace?
Gender bias in the workplace
Ada works in an office of 40 employees. Each individual is represented as a blue (man) or orange (woman) circle.

At Ada’s company, 20% (8 of 40 employees) are women. This mirrors women’s underrepresentation at many North American Science, Tech, Engineering, and Math (STEM) companies (See employment statistics for 2020 here).
How might women’s unequal representation lead to unequal impacts of bias?
.
The impact of bias
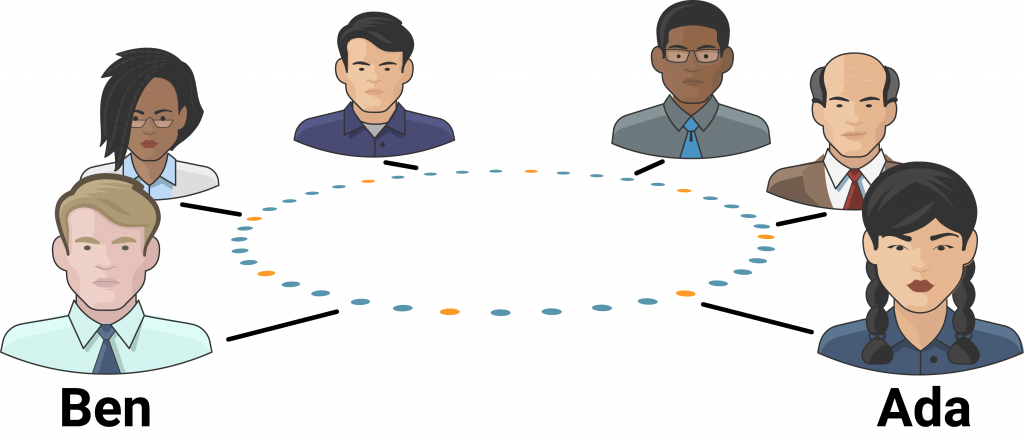
Most of the time, people at Ada’s company get along, but sometimes their interactions are affected by gender bias.
Let’s assume that men and women are equally likely to enact gender bias toward one another. What happens if 75% of these interactions are neutral (represented by gray arrows) and 25% of interactions are affected by gender bias (represented by red arrows)?
If everyone has 3 interactions with another person on a given workday, here is what an average day at the office would look like:
Notice that individuals who are targeted by bias are pushed out of the network as their inclusion decreases.
Reflect: Who is pushed out more?
Compounding biases
According to the Petrie Multiplier, even when two groups have an equal likelihood of enacting bias toward each other, the underrepresented (smaller) group experiences more harm.
This principle also applies to social categories beyond gender, such as race, sexual orientation, ability, class, and more.
Additionally, since people hold multiple social identities at the same time, the impact of bias can vary depending on the intersections of their social identity (learn more about intersectionality here).
Try it out
How to use the simulator
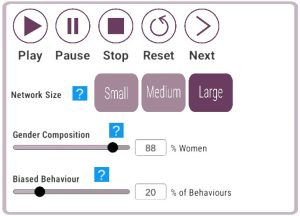 |
Simulator control panel:
|
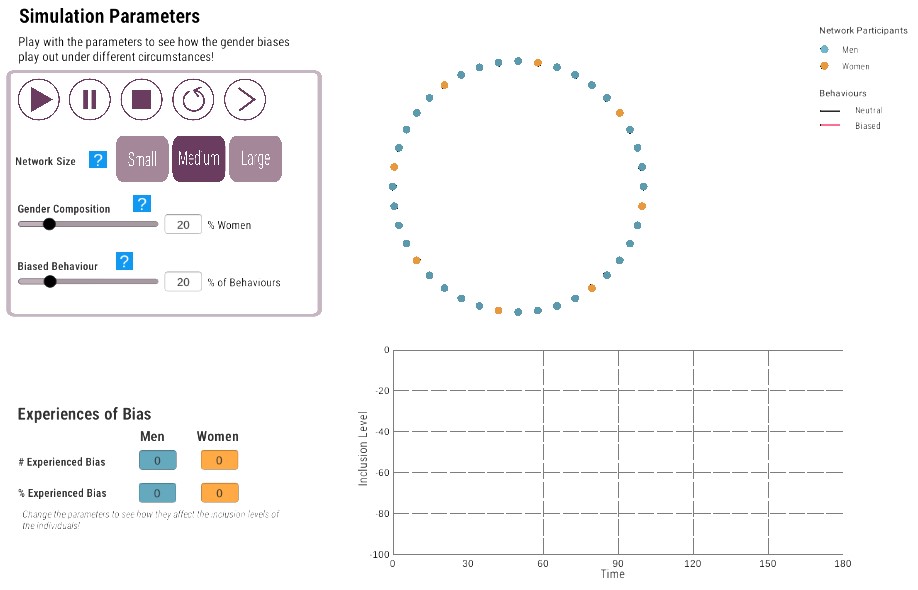
Monitoring inclusion with a graph
 |
|
Use the simulation tool below to see how unequal representation leads to unequal impacts of bias.
By default, we have set the gender composition to 20% women and biased behavior to 25%. Run the simulation using these parameters, then change them to see what happens.
Click here to access simulator
From Ada’s perspective…
![]()
 Follow