
Portfolio Summary of Week Five: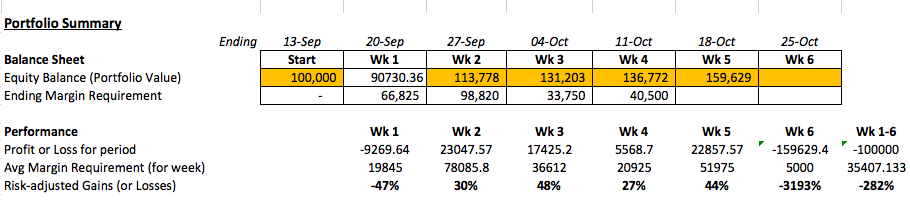 During this week, I made a few trades for corn and wheat. I am kind of addictive in candlestick chart, so the most decisions I made is based on it.
Corn
After the corn reached the lowest point of three years on last Friday, the price of corn rebounded a little this week. I longed 10 units of corn on Monday, and sold them on Wednesday.
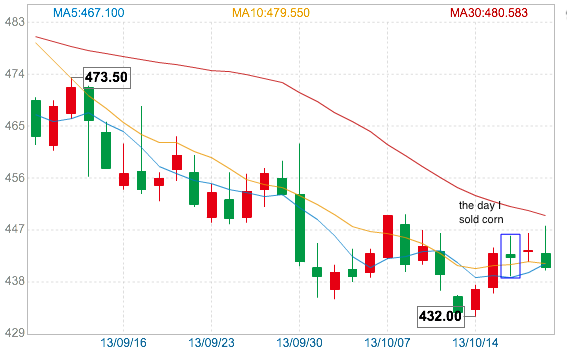 The candlestick chart on Wednesday is called spinning top. The characteristic of spinning top is that both upper shadow and lower shadow are relatively long and the body is relative small. It means indecision. The small body indicates that the difference between the open price and the close price of corn on Wednesday was little. The two long shadows represent that both sellers and buyers were relatively active during this day, but neither buyers nor sellers can dominate the trade. This spinning top of corn appeared after a long advance candlestick on Tuesday. It shows that the advantage of buyers may be limited and the increasing trend of corn price may change. Thus, I sold all my corn this day.
Wheat
During the early days of this week, the price of wheat retraced, but the price continuously increased on Thursday and Friday. I longed 10 units wheat on Wednesday, so I had 25 units wheat in total. On the Friday morning, I sold 10 units wheat.
Below are the reasons to explain the decisions I made.
The candlestick chart of wheat
 The candlestick chart of wheat on Wednesday has a long lower shadow. The long shadow means that most of trades are made during the day rather than near the open and close. The long lower shadows and short upper shadows represent that the sellers dominated the trades on Wednesday and drove the price of wheat decreasing. The buyers, however, showed strong interests in longing the wheat and bid prices higher by the end of the day. Thus, the close price was relatively strong.
The candlestick chart of Friday day is also very interesting. The body of candlestick is quite long which means that the price difference between open and close is large and the buyers are aggressive to long the wheat and control the trade.
The line chart of wheat on Friday From the chart, it is easy to find that the price of wheat dramatically increased in the early morning of Friday. I don’t really understand why this happened and the only commodity in my hand was wheat, so I sold 10 units wheat to reduce the risk. (I still remember the situation happened half month ago. The prices of agriculture commodities increased dramatically before the stock announcement of USDA on September 30. After this unanticipated announcement, the price of corn and soybean went down rapidly.)
Highlight Events of this Week
 The USDA Re-Opened This means that the traders can get accurate reports and the volume of trade will increase. On next Monday, USDA will announce the US crop progress. On next Tuesday, it will announce the wheat data, which is really important for my wheat trading.
Wheat Prices Rise to 4-Month-High On Friday wheat price rose to the highest level since June. The reason is that the Argentina, the second-largest producer of wheat in the Southern Hemisphere, forecasts 8.8 million metric tons of wheat production for the 2013-2014 harvests. This is significantly lower than the forecast of USDA in September, which is 12 million metric tons. In addition, Russia may lose 4 million metric tons of wheat next year because rains restricted planting of winter crops. Please see Russia May Lose 4 Million Tons of Wheat as Rains Hamper Planting.
China GDP hits 7.8% The National Bureau of Statistics of China announced that the world’s second-largest economy grew 7.8% (faster than expected) during the third quarter of the year.
P.S. The news of economy growth of China is an important reason to explain that the prices of November crude oil rose 14 cents, or 0.1 percent, to $100.81 a barrel on Friday. Since crude oil functions as the benchmark of the commodity market, the GDP growth of China might be a good news for the traders of agriculture commodity whose trade is long-position.
 Good luck ~
Hi Amanda, these are excellent results and I can tell from following your blogposts that you’ve become an increasingly sophisticated futures trader. And you actually know what you are doing. I’m also glad that you’ve been posting your risk-adjusted returns, which definitely makes it quite easy for others to follow your performance, keeping in mind how many contract positions (how much risk) you actually had on. Very glad that the candlesticks are working out for you. You also have one of the cleanest, neatest, easy to read blogs. So really great job.
Thank you, Mark.