funtime

Just another UBC Blogs site

funtime header image 4

London Congestion Charge

March 22nd, 2013 by amberzhang
Respond

London congestion charge

London’s traffic system has a notorious fame around the world. But can merely rely on the economic theory to charge on the congestion problem can solve it?

Normally, the economic theory can only applied in the optimal situations; any externalities or uncontrolled factors could ruin the idea.

However, there are more than one cities are implementing the charge on traffic, such as Singapore, Olso and Bergen in Norway[1]. So in this blog, I will introduce what is this charge, what’s it coverage and how it works.


The congestion charge is summarized as below:

Year of policy Charging time Charge amount
2003.Feb.17-2005 7:00am-8:30pm 5 pounds
2005.July- 7:00am-8:30pm 8 pounds


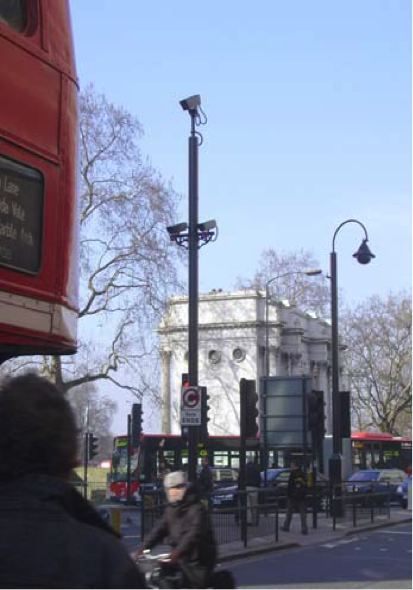
During the weekdays of charging time, whenever you enter into the charging area, which located in the central of London, you have to pay such amount of money, excluding exempted vehicles. Payment was made convenient to citizen, can be paid either by phone, Internet or buy the charge fee in an outlet. Thinking of how to escape from it? No way, city was spread with cameras, the vehicle plate number will be taken by the camera and compare with system of paid list. Motorists who haven’t pay will face a fine as high as 120 pounds.


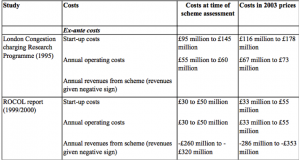
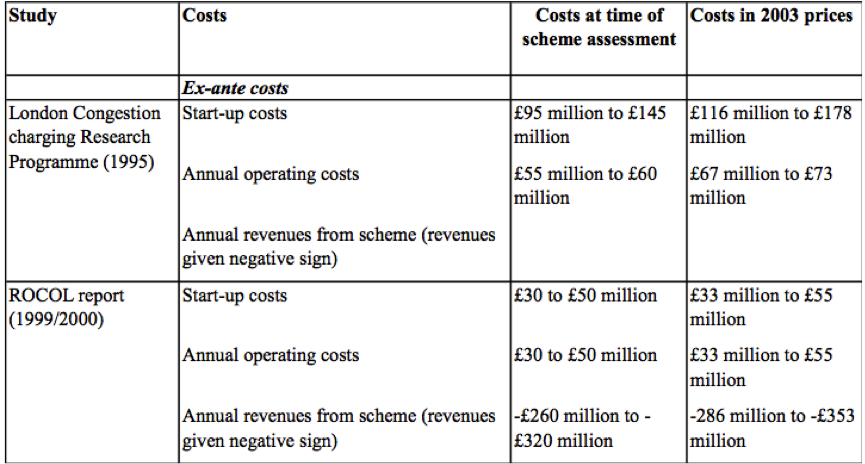
This policy was expected to generate a revenue of 100 million pounds per year.

Effectiveness:

It is reported that this policy has largely increased the traffic speeds. Average traffic speed during the charge days (weekdays) has increased 37%. Peak hour congestions has decreased 30% and bus congestion delays has decreased around 50%. Bus ridership increased 14% and subway ridership increased 1%.  Overall amount of transport in London has decreased during the past years around 21%, which equal to 70,000 vehicles.  According to the source from Transport in London.[2] .

The statistics shows positive signs of the effectiveness of this policy scheme. There are also counter points that prove congestion charge does not necessarily works. Despite few cars, according to the statistics, congestion rose significantly during 2005-2006. And average traffic speeds in central London falls from 10.6mph in 2003 to 7,1 mph in 2006.

Although it was justified by the reason such as city fundamental facilities [3]constructions: such water and gas mains replacement. It raises the doubt in its effectiveness..

Nevertheless, there are ways to increase the effectiveness of this policy. For example: we can differentiate the charges by the miles driven, and areas you are in and time that vehicles in the city Centre. Also, citizen’s transit option has been limited in some degree; London should provide a better substitution, such as the bus and subway. However, according to my friend in London, in certain area, he can walk faster than taking a subway. Revenues of the policy should be used to upgrade the public transportation to reduce the externalities caused by this policy.

Drawbacks of the charge:

  1. Consumers may consider it as a suspicious charge. No one is willing to pay extra and living under the control of the surveillance camera.
  1. This policy may reduce the social welfare in the way that it reduced the retail revenues of downtown, according to London Chamber of Commerce[4]. In the survey of 2003, the small retailers blamed this policy as the reason of recession of their business. And over time, the small retailers may consider moving out of the Center area.
  2. No differentiate in the charging in aspect of rich people and poor.
  3. No differentiate of charges in the time, area, and miles of driven. With these factors into consideration, congestion charge policy could be more effective.

Advantage of policy:

  1. Create revenue for public transportation upgrading.
  2. Decreased the overall motors on the street of congested area and furthermore reduce the pollution.
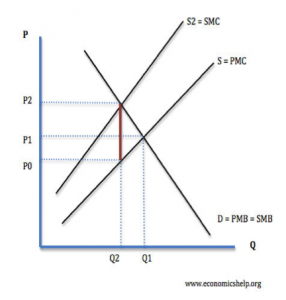
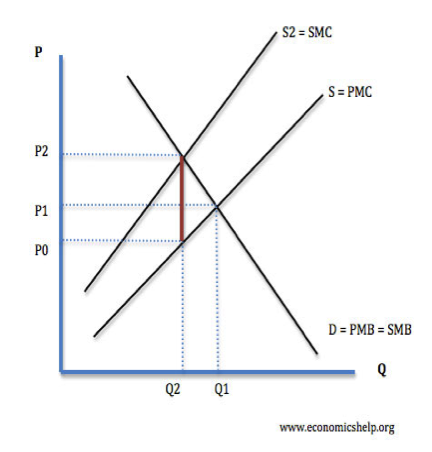
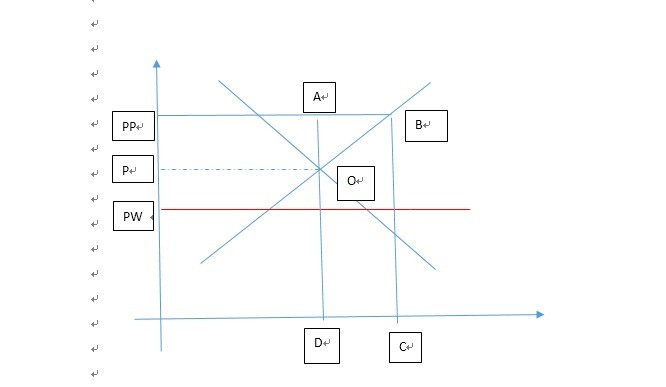
  3. Put a price on the externalities of the congestion. According to Pettinger (2011)[5] Social cost of congestion is estimated as 20 billion pounds a year. It fixed the problem that petrol tax which cannot differentiate the portion of driving contribute to the congestion[6].

Analysis of the possibility to duplicate

There are certain qualities that a city should have to adopt this policy.

  1. A city with circle routes, so that driver can choose other ways to circle around the charging area.
  2. This policy requires large investment in research, installing and operation, so city with a smaller scale may not affordable.

Image retrieve from website[7]:

  1. City should have other transport options. So that the policy won’t create unnecessary inconvenient to citizens which constitute another externalities.
  2. This policy requires large investment in research, installing and operation, so city with a smaller scale may not affordable.
  3.  The education level of the citizen should also be a precondition of the policy, So that the facilities won’t be wrecked frequently.  It seemed ridiculous, but from personal experience. This is really a serious aspect should be considered.


[1] http://www.vtpi.org/london.pdf

[2] http://www.tfl.gov.uk/tfl/cclondon/pdfs/ThirdAnnualReportFinal.pdf

[3] http://www.independent.co.uk/news/uk/home-news/the-big-question-has-the-congestion-charge-been-effective-in-reducing-londons-traffic-781505.html

[4] www.londonchamber.co.uk

[5] http://www.economicshelp.org/blog/143/transport/how-effective-is-a-congestion-charge/

[6] http://www.economicshelp.org/blog/143/transport/how-effective-is-a-congestion-charge/

[7] http://www.google.ca/url?sa=t&rct=j&q=london%20%20congestion%20charge%20detailed%20assessment%20&source=web&cd=1&cad=rja&ved=0CC4QFjAA&url=http%3A%2F%2Fuk-air.defra.gov.uk%2Freports%2Fcat09%2F0505171128_London_Congestion_Charge_Detailed_Assessment.doc&ei=rQZNUdWsKavPigKU9YHABA&usg=AFQjCNHlBvPnTCDJfy2OlC8OBhXQKdfHjQ&sig2=98KXUcF0mas9Z1dwZEoijg&bvm=bv.44158598,d.cGE


Tags: No Comments.

policy brief on Chinese rice minimum purchasing price

March 19th, 2013 by amberzhang
Respond

Policy brief

On Chinese government’s purchasing policy of rice in 2012


For decades, china is the biggest rice producer, exporter and consumer in the world, now became an big importer in 2012. China has net import record of rice for four times in the past 50 years. 2011, china imported 575,000 tons of rice, while in 2012, it remarkably purchased 2.6 million tons of rice[i].


Last year, the Chinese government had increased minimum purchase price of paddy by around 9% to 17%. According to the UN’s Food and Agriculture Organization (FAO), rice prices in China have increased over 18% in the last two years and the purchasing price has been increasing 5 years in a row. Because of this policy, price of the indica variety in Hubei, China, is at $ 625 per ton in September, 2012. By contrast, Vietnam’s price is $451 and Thailand’s $598[ii].


To farmers: The purpose of minimum purchase price is to largely boost the domestic supply also pushed up the domestic price of rice. This indeed can increase the farm income on the consumptions of no import involved and all the rice output can be purchased at minimum price.

However, minimum purchase price wasn’t apply to every rice farmers. The scheme of purchasing policy is plan to be done by the ” market”[iii], government mandated the lowest price that processing companies ( not by government itself) pay for the farmers. While facing a much lower rice price from countries such as Thailand and Vietnam, Processing companies undoubtly choose to buy imported rice rather than local rice. This policy turnout pushed rice price down, rice farmers and small scale millers will be hurt by this. In this logic, government’s announcement about increase minimum purchase price will further hurt farmer’ welfare[iv].


To world market:

Rice consuming countries are normally large producing countries, hence the international trading volume of rice is only a small fraction of world production. According to FAO data[v], the world trading amount is 37.3 million tons which is 7.7% of world production.  Average rice consumption of china is 0.14 billion. Any surge or decline in major production/consumption country may lead to violate in world rice prices. A sudden increase of rice price in 2008 had caused prices of other agricultural commodities and lead to a food crisis.

Keeping this pace, people may worried that whether the rice production of other places can feeds the need of Chinese market. If exclude food security issue, not in a far future, international market price will reach to the same level of domestic price Importing may shrink.

To society:  Consumers now have access to larger amount of cheaper foreign rice, consumers’ surplus has been increased. However, for the farmer, larger output but lower sales leads to not only opportunity cost and inventory cost. The average storage loss is 7%~10% which equal to 300~340 million tons.  Thatr is a dead weight to the society.


This model illustrate the minimum rice purchase price policy (externalities and storage loss are not included).

Pw: representing importing price

Pp: represent purchase price

P: is the domestic price, which is the selling price from trader. The optimum selling price for trader is at pp with all information known. But which is impossible, I assume they sell at equilibrium price to meet market demand which on the other hand also pushed down domestic price assumed to be.

Stimulate by government policy, the producing amount increase from D to C.  With importing, market equilibrium is at O, making the ABCD the dead weight loss for the society. Traders get the amount of surplus POPw. Farmers’ loss the assumed surplus of PpABOP.

Recommend: aside of food safety issue, to make this policy benefit farmers, government should put a restriction on import such as quota or import tax. Or, the government should undertake the purchase responsibility, instead of “ market” . With direct payment from government, rice producers will have more incentive to push up output.


[i] http://cambodiariceexporters.org/en/news/rice-news/458/China%20Plans%20Higher%20Rice%20Purchase%20Price%20in%202013.html

[ii][ii] http://www.bloomberg.com/news/2012-12-12/rice-imports-by-china-set-to-jump-fourfold-on-local-prices-1-.html

[iii] http://www.zglssc.com/info/infoNext.aspx?id=116614

[iv]http://online.wsj.com/article/SB10001424127887323706704578228052284001608.html

[v] http://www.fao.org/economic/est/publications/rice-publications/rice-market-monitor-rmm/en/

Tags: 6 Comments

landfill tax in UK

March 8th, 2013 by amberzhang
Respond

I found landfill tax would be very interesting and necessary for the society. In UK threw away a staggering 22.6 million tons of rubbish in 2004/5; in fact, Britain sent the same amount to landfill as the 18 EU countries with the lowest landfill rates combined, despite these places having twice the population of the UK. Many people in UK are concerning that we are running out of land for landfills.


Hence, in 2006 UK started to impose landfill tax by charge extra money per tons of garbage and landfill operators are the ones who responsible landfill tax. It was referred as the “the UK’s first tax with an explicit environmental purpose”[i][ii]. UK government promise to use the tax revenue on waste management system which can recycle 25% of household waste. An interesting thing is that the government cut employers’ national contribution insurance to soft the tax’s impact to society.

A tax or fee imposed on landfills or other disposal facilities normally is as a means of raising general revenues, to generate funds for inspection programs or recycling program, or as a means to make direct disposal not the most attractive ways to handling garbages. Landfilling is discouraged due to a number shortages[1]:

  • Climate change caused by landfill gas from biodegradable waste
  • Loss of resources
  • Constraints on areas suitable for landfill sites
  • Loss of recyclable components of waste landfilled
  • Uncomfortable feelings of citizens: nimby issues.

In 1999, the UK government update its strategy with “a way with waste”. It increase the tax rate to 10 pounds per tonne and also introduced “Landfill Tax accelerator” which would raise tax rate 1 pound each year until 2004. Following that, 2004 to 2007 landfill tax increased 3 pound per year next three years. After 2008.the chancellor announced that there will be 8 pounds increase each year until 2013. Floor price for landfill tax is 80 pounds per tonne in the year from 2014 to 2020.

Allocation of Revenue
With regard to allocation of landfill tax revenue in the UK, its introduction was in alignment with a reduction in employers’ national insurance contributions which in case it’s only a transfer of welfare. As respect to the UK landfill tax credit scheme , it was aimed at encouraging landfill operators to support projects with environmental objectives, such that tax credits can be claimed in respect of funds used (up to a maximum of 20% of their tax liability).  This scheme was halted and the UK treasury has yet to decide what to do with the extra revenue generated (EEA, 2005).

Evidence and Effectiveness of UK landfill tax:

The successfulness of the landfill tax in diverting waste away from landfill sites is difficult to assess. There are also other instruments are introduced at the same time, such as landfill bans.  In the case of the UK, the tax has not been set high enough to result in a significant change, however in countries where the tax is high (for example Denmark) other instruments have also been introduced at the same time.  Landfill taxes have proved to be a useful source of funding for developing an effective infrastructure for the waste (EEA, 2005).

UK has the highest percentage of waste being landfilled, but the tax rate of landfill was among the lowest. The evidences to prove the success of UK landfill tax was mixed. In 2000, research shows that strong evidence of increase of recycling activities and significant decrease of construction and demolition wastes. But other articles, Martin and Scott (2003) states that UK municipal wastes kept a rising increase rate.

Undesirable outcomes also comes along with landfill tax. Because of the tax, many wastes went to unlicensed landfill sites. Local institutions are often constrained by long term contracts that they can’t accelerate the pace of change. Obviously, the institutional power was not strong enough to enforce every landfill sites obey from the law. Another odd things is, by only add burden to the landfill operator, landfill tax has least impact on citizens and non-construction companies who are the largest contributors to municipal waste. For citizens, landfill tax is integrated with council tax, which is a flat rate. It won’t provide enough incentive for citizens to reduce waste. To those companies, the landfill tax is too small that companies don’t even bother to care.  However, behaviors such as reducing over packaging or buying unnecessary products and recycling should be the ultimate purpose of tax.

Institutional power is also a concern.[iii] Loophole in the tax also provide incentives for unofficial dumps. But due to constrain of resources, this kind of behavior cannot be fined or forbid completely. Also, local authorities also can’t find its way to reduce tax liability if anyone increased amount of recycling.

Future

Besides increasing the tax rate for landfill, UK government also announced that landfill allowance trading scheme would be removed after scheme year of 203. This move is for small businesses who may not have advantage to have allowances.

Under the EU Landfill Directive, the UK is obligated to reduce the amount of biodegradable municipal wastes sent to landfill based on the amount of this material landfilled in 1995 to 75% by 2010, to 50% by 2013 and to 35% by 2020. The definition of municipal waste recently changed and the tonnage of the new targets is given below[iv]:

Landfill Diversion Targets (‘000 tonnes)

2010

2013

2020

England

21,773

14,515

10,161

Scotland

2,697

1,798

1,258

Wales

1,378

919

643

Northern Ireland

919

612

429

UK

26,766

17,844

12,491

Following discussions with the European Commission, Defra has changed the definition of municipal waste, and now includes some Commercial and Industrial waste as well as most of the existing local authority collected waste.


[1] http://en.wikipedia.org/wiki/Landfill_tax


[i] http://www.politics.co.uk/reference/landfill-tax

[ii] http://www.economicinstruments.com/index.php/solid-waste/article/280-

[iii] http://economicinstruments.com/index.php/component/zine/article/223

[iv] http://www.defra.gov.uk/environment/waste/local-authorities/landfill-scheme/

Tags: 6 Comments

Carbon Emission Control Policies in California (RPS and Cap for example)

February 7th, 2013 by amberzhang
Respond


California, as one of the pioneers in reducing carbon emission which has panels of ambitious policies to reduce the carbon dioxide in this world. Back in 2002, California has set up California air resource board to prepare the system of protecting the air.

And finally in 2006, the government of California has been able to launch the Global Warming Solution Act.  It contains several different measures, such as renewable portfolio standard(RPS), Renewable Energy Production Credit(REPC) trade and cap, offset, manure management, forestry and landscape gas capture. In this blog, I only explored something about the RPS and cap-and-trade policy.


 Renewable Portfolio Standard

An noticeable measure to reduce carbon emission is called Renewable Portfolio Standard (RPS). This policy was first initiate in 2002, by California bill SB1078, and was said to be the most ambitious GHG control policy in USA. It aimed to make all electricity utility procure 20% of renewable energy in their inputs. Following 2002, in 2006, BA32 bill produced that by 2020, the percentage of renewable resource will be reach to 33% which is a very high standard, exceed the standards in other states like Oregon and Minnesota.


Renewable portfolio is more like an indirect subsidy. Rather than costing the money of taxpayer, the government allows the new energy technique to compete with each other. And the lowest cost one will become renewable energy portfolio provider. Thus, this may push the invention of better renewable fuel or new renewable recourse, on the condition that California and other many states also has RPS, so there’s no way to export dirty energies and import renewable fuel to circumvent this regulation.


In this sense, I believe the renewable portfolio program is relatively more cost efficient. Rather than direct giving out money, it encourages the competition in the market and also allows electricity companies switch other sources, if the current renewable energy is too much costly.


Government also applies cost control policies on RPS, see detail policies in below[i]:


The main findings from cost control policies of RPS are significant. As we can see from the above, more than half of the approaches to control cost are not as good as expected.

1. The cost cap are political determined but not base on economic side of view, hence it will conflict with the goal of policy.

2. Cost limit are ambiguously defined.

3. Insurance fee: the cost limits may create uncertainty in the market, the procurement fee might be unavoidable. A more precisely defined cost control policies may avoid unexpected social warfare cost and support for the environmental protective policy.

[ii]

An research (Bushnell & Wolfram, 2008) analyzed the social warfare cost at different levels of RPS. RPS will significantly increase the electricity retail price, at the level of 5%, there’s total customer loss. At 20% level, both customer and producer are losing, only with higher price, producer has smaller loss compare to customer. But, there’s a footnote state below the graph that, the economic surplus measures do not include any environmental benefits resulting from the policy. For my level of knowledge, it is hard to define the effect of RPS. Since I can perceive the customer loss as a donation to the environment protection. Other evidence shows, at least, this policy is effecting the industry: 60% more of non-hydro renewable capacity are added within the program by 2002, and by 2006, it became 76%. In 2012, the three biggest IOUs (Investor Owned Utilities) are now serving 20% of their electricity retail sales with renewable power. [iii]


As we are encouraging by these positive information, remembering that California has already set out its another goal: to reach 33% of renewable energy use in 2020. So, I raise my doubt that is California capable of doing that?

From the reading of researches, I found that the main obstacle for California is the money. To support for 2020’s target, 7.2[iv] billions of dollars will be used as upgrading infrastructures (table 1). An energy analysis comment that, With large cities struggling, utilities struggling, people struggling, social services being cut, she said that she believes the state should keep the goal but understand that California’s infrastructure ‘is not prepared for that much renewables.’ However, California has already has budget deficit of 16 million in January 2012, which means more cut will be made in order for the budget. Especially, this state has over 10 percent unemployment rate and a real estate market that has lost 35% of its value. Personally, I doubt for the success of the next goal. Maybe California can slow down a little bit, at last, to rescue the world is a huge responsibility.


Cap and Trade

This method is in fact the tradable emission, government will give out free credit of emission allowance, which account for 90% of the industry emission. And the rest of emission amount can only be bought. Unlike other rigidly restrictions, cap and trade as a market based policy, do not specify amount of emission for which industry or which company or how much they should emit, which may confer the society a larger social benefit and give the resources best allocation.


Compare to RPS, a paper ( Fischer & Newell, 2004)  found out that one seventh of social warfare costs to reduce 5.8% carbon emission[v]. Here is the comparison of social welfare costs between cap and trade and RPS.


But it also has some disadvantages. By putting a cap on the emission of plants within California, it may drive those high emit plant move out of California, and also the current major providers of electricity and CO2 are come from outside of Californian. So it can be circumvent by simply importing from outside of state But the world don’t care where the Green House Gas come from, but what is the amount of it. So no matter how effective this measure is, it may not archieve its ultimate goal, to save the world. This requires collaboration of states around California or even the world.


To make a conclusion, the older ways such as a renewable energy production tax credit lowers electricity price but at the expense of taxpayers and thus limits its effectiveness in reducing carbon emissions. And it also is less cost-effective than a portfolio standard. However, in my mind the most effective ways should be the cap and trade policy, it is less costly and better at promoting new energies.


table 1


http://www.ucei.berkeley.edu/PDF/csemwp166.pdf


[i] http://climatepolicyinitiative.org/wp-content/uploads/2012/06/Limiting-the-Cost-of-Renewables-Lessons-for-California.pdf

[ii] http://www.renewableenergyworld.com/rea/news/article/2012/08/experts-weigh-in-will-california-meet-its-rps

[iii] http://www.cpuc.ca.gov/PUC/energy/Renewables/index.htm

[v] Fischer Carolyn and Richard Newell. 2004. Environmental and Technology Policies for Climate Change and Renewable Energy. Discussing paper 04-05. Washington, DC; Resource for the future, April.


Tags: 3 Comments

India and China expected to double their emission in 2030

February 5th, 2013 by amberzhang
Respond

We all knows that China and India are leading the economic growth speed in the world, without surprise, they are also leading the emission of CO2. Beforehand, US and UK are the leading parts of carbon emission in the world, but now they are more like supporting part, quoted from author.


China is the greatest emitter in the world, and india, account for 83% of emission growth from 2010-2011. However, another article mentioned that not until 2030, china’s emission will continue to rise, even with ambitious air policies. And the amount is equal to the total amount of world carbon emission today.  Base on that, we can imagine the situation in India and imagine the situation for the world.


Green house phenomenon brings greater damage to developing countries than developed countries, since develop countries are more affordable to have pollution treatment. In the meanwhile, developing countries are so obsessed with economic growth and competi


But, when come across the topic which has been discussed for so long: who are going to take the major responsibilities to reduce the emission in the future, meaning, the major cost. There are too many obstacles for those developing countries, according to research, if india and china are going to reduce 30% of emission, their output will reduce by 6~7% and export amount is more than that, which is unbearable.


But there’s no compromise for the world. If to be fair, letting developing countries emits the same amount as developed countries used to do, it just become another disaster.

Those above topics are covered in a book named Greenprint: A New Approach to Cooperation on Climate Change. and support with rich data analysis and research.  I found it are so relate to our course and so interesting, hence I recommend to everyone here. Anyway, I am going to buy it on amazon. J


http://ec.europa.eu/environment/ecoap/about-eco-innovation/policies-matters/eu/390_en.htm

http://www.wired.com/wiredscience/2008/02/chinas-2030-co2/

http://www.guardian.co.uk/environment/2012/nov/26/china-emissions-rise-green-policies

http://www.economist.com/news/books-and-arts/21571109-emerging-markets-are-big-part-problem-they-are-essential-any-solution-take

Tags: 2 Comments

Beijing Air Pollution

January 28th, 2013 by amberzhang
Respond

Bejing now is going through a war with its air which has kept a horrifying AQI (air quality index) since one month ago. Any reading exceeding index of 100 is regard as unhealthy for sensitive groups. However, Beijing even got a record of 785 which always has a steady performance of over 500.

The most obvious effects that polluted air will bring to us is the harm to citizens’ healthy. In fact, any index above AQI 400 is hazardous for all people. The unhealthy of people will bring lower product efficiency and the frequency of sick leave will be higher, etc. Also Bad air will erode facilities and buildings, and also be a obstacle for Beijing to draw investment or excellent people to settle down.  Those effect on economy is uncountable.

In environmental economic, this externality is brought by excess vehicles in Beijing, the number of which is half as Tokyo but twice time the intense of use,  and coal burning around Beijing area. We pay for gasoline and expensive cars but never paid for the emissions from cars. And also for the coals, they are never priced for their poisonous emissions.

So far, the cost to bring down the air pollute has not been public nor the effect has been shown. but one thing can be sure is that cost is not going to exceed benefit, because no one is taking the price of air, a precious and finite resource, into consideration. For now, air is non-rival and non exclusive, but who can say that in future?

refernces:

http://www.economist.com/blogs/analects/2013/01/beijings-air-pollution

http://www.chinadaily.com.cn/china/2012-06/11/content_15494160.htm

Tags: 12 Comments

what went right/wrong week 8

November 23rd, 2012 by amberzhang
Respond

one day i wake up, found the soybean market was falling apart, i quickly closed those contracts. result loss for the first three contracts.

then the following 3 long contracts were due to system error. i transacted three contrac without my order.

then, i went long on wheat, but it turn out  delcining, to stop loss, i closed them,

another three short soybean contracts, again, system error.

and this is pretty much the story.

Tags: No Comments.

cool source ( week 8)

November 23rd, 2012 by amberzhang
Respond

1. http://money.cnn.com/2012/07/19/investing/corn-soybean-prices/index.htm

CNN MONEY.  not a good site for first hand information, but it’s good to learn anlytical skills


2. http://www.farmdoc.illinois.edu/marketing/mobr/mobr_08-04/mobr_08-04.html

A big website that you can find all agricultural news and reports here.

Tags: No Comments.

the road ahead week 8

November 23rd, 2012 by amberzhang
Respond


The road ahead (week8)

Last week is a big mess. I lost several thousand because of delayed action. And the system has gone long for me, when the market was lashing and goes short for me at the market lowest price ever.

Soybean has decreased from 1500 plus to below 1400. The reason for this is goldman( a fund was disposing their holding of long contracts. Also, estimate of yield was higher than expected for 3%.

In the previous blog I noticed that there might be disposing of funds, which happened last year. I thought it was a valuable information but since of the time constrain I didn’t dig it deep. And the market before disposing can be quiet confusing: the price would not fluctuate as usual, keep stable for several days and began to slump.

I got the lesson as well as some inspiration of long term operation. Every summer the price of  soybean and corn will reach to the peak price. It would be a good choice to hold short position when the price is high until mid of December.

Tags: No Comments.

cool sources( week 7)

November 3rd, 2012 by amberzhang
Respond

1.Open blog

http://openmarkets.cmegroup.com/

blogs from CME group. Blogs from expertises are not always bible, but their thinking pattern and analysis apporach can inspire you. And also those blogs can help us rise a good sense to the market.

2. Agremongy  http://www.agrimoney.com/

Another good website which has latest information of commodity market.

3. Risks Associated With Investing Directly or Indirectly in Corn   http://teucrium.com/component/content/article/81

A comprehensive introduce of the riskes in corn market. Whoever is operating in the market is worth to take a glance.


Tags: No Comments.