Monthly Archives: November 2017

FAREWELL REFLECTIONS – Week 11

What, So What, Now What? – Reflecting on our last moments and wrapping up…

WHAT

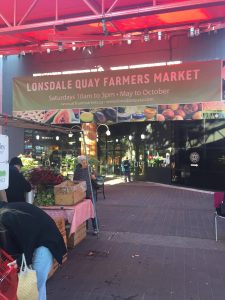
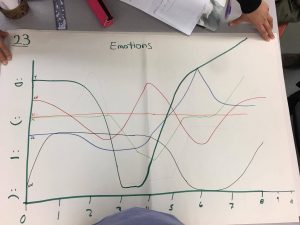
Throughout our time in LFS 350 and working the the North Shore Artisan Farmers’ Markets, we experienced many ups downs, many challenges, many “Why are we doing this” conversations, and frequent uncertainty. It was a long journey to the finish line, but now that we are nearing it, we are experiencing our first moments of victory and evidence of the success of our work up to this point.

During this journey, the most important aspect of our project was the methods we used for data collection. We first transferred 10 years of hardcopy vendor data from all three Artisan Markets into an electronic database where it was organized by location, name and type of sellers. This was an incredibly tedious process, but ended up serving us later and contributed to our final victory moment.

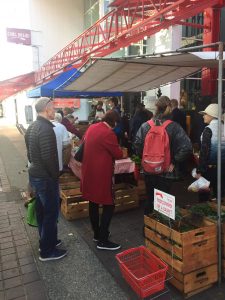
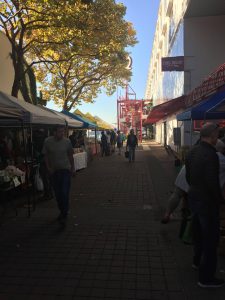
Before creating the survey questions we made an initial trip to both Lonsdale and Ambleside Markets to understand context of the environments of our future survey participants. From there, we developed draft survey questions, had them approved by our community partner, made appropriate changes, and finalized our surveys. We traveled to both markets and collected more in-person surveys than we intended, but still felt like we wanted to collect more data. We decided to contact other vendors that were not present when we visited the markets via email. Collectively, we were able to formulate an online survey through UBC’s platform to replicate a physical copy that we had handed out at the farmer’s markets. In total we received more than 60 survey responses in total and completely blew our original goals out of the water!


SO WHAT? 

Data analysis was definitely something that was a moment of significance for the group research project. All of our activities in data collection over the past month required everyone to collaborate. We had piles of data. What kind of analysis could we do? What conclusions could we make from this data? What tools did we need? How could we organize it? It was daunting and scary to look at

Those were the questions that were running through our heads. We had a variety of data that needed to be analyzed computationally and it was entirely up to us. The prospect of success in the early stages was daunting. Luckily Ayra, had a pretty solid understanding of statistical analysis and ANOVA. She had previous experience with handling data and running statistical analysis on numbers just like these. This was a big turn for the project as these were analysis tools that could give us results and conclusions that would actually be realistic and relevant for our community partner. The milestone was definitely finally getting a real understanding of the data we collected.

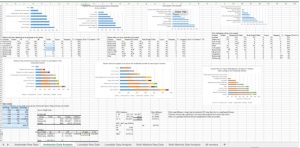
As Ayra was running some analysis, we began to notice important patterns. For example, farmers were doing the best financially than any other type of vendor and the longer the farmers sold at a market, the more money they tended to earn daily. It was exciting to see as we were already thinking about what to include into our report and what conclusions we could make for our presentations and infographic.

All in all, we were able to collect data from vendors, compile it, and analyze it to understand the attitudes of farmers and what their motivations are. As we are beginning to see some patterns and conclusions, we are starting to pick out what what we believe is most important for our final report. Tara was able to help us significantly with the data analysis and she was very interested in the patterns that we were discovering together. It was one the project’s deliverables to collect more data that could be useful for Tara. We were lucky enough to have Ayra and Tara work together to make something of the numbers that we had collected, and she loved the data.

Now What

With the results in, we are excited to see what we can do with the data. It is exciting that we can already make some conclusions from what we have. 

Although we will be including all of our findings in our final report to our community partner, we need to choose which items are most important for our infographic and presentation next week.

For example

  • 57% of vendors say the type of customers in this market are what they enjoy most
  • 73% of vendors say that the market location are what they enjoy most
  • 33% of vendors say that the change in market location is the most challenging aspect in selling at the market
  • 27% of vendors say that the amount of sales made is the most challenging aspect when selling at the market

We are now moving forward with transferring our data and conclusions onto both an infographic presentation and final report. We never would have been able to come to these conclusions the way we have without all of the little victories that lead to our eureka moment with our data. From this results, we are slowly beginning to come up with implications. Why are these numbers important? What can we do to change these numbers? Now, as a group, we are deciding what our recommendations are for the market as the ultimate goal is to have a market structure that integrates the needs of vendors, consumers and the community. For ambleside, our data suggest the location of the market has been an issue therefore our recommendation is to increase marketing and accessibility to the new location in Ambleside. As for Lonsdale, increase consumer participation for increased profit is needed. Our recommendation is to increase an incentive for consumers to participate  which can include coupons and community events. Now, this research is not yet complete. The class of LFS 350 2018 aims to support the ultimate goal of vendor and consumer participation. Future research will give us a better understanding on implications to make both parties happy.

It has been a great semester being involved in this community research, and we can’t wait to see the impact we have on this market! We all had a great time with this project, and it was blessing to be working with great group mates as well as an engaging community partner. Big thanks our TA Willson Mendez, Will Valley, and the teaching team for being by our side and giving us support when needed. Along with the further research to be conducted in the future, we can see big a big future for market improvement!      

Preparing For A Successful Completion – Week 9

Weekly Objectives and Achievements

Weeks Weekly objectives Achievements
7 Next trip to the farmers markets to conduct surveys.

→ October 21st and 22nd.

Finish question bank and formatting survey

Survey questions need to be reviewed by Tara

Questions have been approved by Tara and it looks like she likes our proposal and our project is pretty much formed.

Hard copy surveys have been distributed to vendors at  Ambleside – table 1

Started data entry on excel

Finalized our survey with necessary questions

8 Team working meeting  –  Cold call and email randomly selected vendors to complete survey

Finish data collection with physical surveys at remaining farmer’s market (Lonsdale)

Online surveys are created

Email surveys have been sent to 434 vendors (have participated in the past / are participating in the market) in both Ambleside and Lonsdale locations – table 1

42 online responses received from vendors

Start organizing online responses

Data from hard copy surveys have been entered and organized

Completed physical survey data collection at both Farmers Markets

Started working on blog post 3

9 Mapping moments of significance

Blog post due

Finish data entry from all collected data

Start analyzing data through ANOVA

Submitted blog post 3

Reflection through completion of skills/emotion/knowledge graphs in tutorial

Collected data are prepared for analyzation

Achievements in detail:
Table 1. Number of surveys sent to vendors/responses received from vendors

Type of Surveys Locations Number of Surveys

Distributed/Sent to Vendors  

Number of Responses from Vendors
Email (online) Ambleside & Lonsdale 434 42
Hard copy Ambleside 20 19
Hard Copy Lonsdale 8 5

Moments of Significant Change

      During tutorial session, our group’s participation in the “Moments of Significant Change” workshop helped us reflect on working with the Artisan Farmers’ Markets and the process of experiential learning. First, we individually assessed how our emotions, values, beliefs, and attitudes have changed since week one. To do this, we set up a graph with the y axis as “stages of emotion” (sad, neutral, satisfied, happy) and the x axis as “weeks” (1 to 13). As one could expect, our individual emotions graph each had ups and downs in different weeks. However, upon combining our graphs into one collective group graph, as the second part of the workshops, it was clear that we experienced similar dips in our emotions during week 3 and 4. When discussing our reasons for feeling this way during those weeks, many of us expressed that uncertainty of where the project was headed played a key role. Furthermore, some of us felt frustration due to conflicting goals from the Artisan Farmers’ Markets and the course objectives. However, as the graph indicates, weeks 4 to 8 have been increasingly positive in terms of emotions for everyone in the group. As the group continued on and we received feedback from our project proposal, increased confidence within our group led to better attitudes and emotions within the group. We were very fortunate to have the Artisan Farmers Markets general manager, Tara, join us in tutorial this week and it was interesting to see how this experience has been so far from her perspective. It turns out, our group was able to share the same excitement with the Artisan Farmers’ Markets in terms of emotions after week 4. In fact, we felt like this workshop helped us bond with our community partner immensely through reflecting on our work so far and having the opportunity to celebrate our achievements thus far.

      The Moments of Significant Change Workshop also allowed us to reflect on the development of  our knowledge and skills since week one. Again, we set up individual graphs first with the y axis as “beginner, moderate, pro” and the x axis as “weeks” (1-13). After combining our individual graphs into a group graph, we saw some similar patterns. As indicated by the photo of the graph below, our group have experienced steady growth in knowledge and skills. During discussion, we all felt like visiting the farmers’ markets during week 3 and 4 was a significant experiential learning moment. It was interesting to share and witness how each group member gained something different from the experience. Despite visiting the same markets and talking to the same vendors, we all took home different knowledge and remembered different parts of conservations we shared with vendors. As far as skills development go, there has been a steady growth as well. However, the development has been slower than our growth in knowledge. Upon reflecting on this pattern, our group came up with one possible reason for this. Throughout the project, we have been utilizing individual’s’ strengths to complement for each others’ weaknesses. For example, if one group member’s weakness is blog writing, another group member will step in while the other member, who is weak a writing, can spend her/his time contributing to the project in a more productive way. Thus, we have limited ourselves in skills development in some aspects. With that being said, our group agreed that we have all developed teamwork skills throughout the project. This includes communication, attentive listening, problem-solving, and negotiation.

       Moving forward, we have agreed that maintaining the upward growth for emotions will be crucial to our success for completing this project. Although a busy month is ahead of us, this tutorial workshop helped us reflect on the importance of keeping a positive attitude. In addition, we agreed to keep expanding our knowledge and skills by switching up some roles for the remaining weeks. We are excited to help each other out in developing and bettering our skill sets. Check out our graphs below!

Graceful Dismount

Over the past two weekends we split our team between Lonsdale and Ambleside to distribute the surveys we had worked with the Artisan Farmers’ Markets general manager to develop. After collecting as many surveys as possible in-person, we distributed electronic versions of the survey to current and past vendors via email. By the end of the month we will have analyzed our collected data and presented our findings to the organization. As this time approaches, we need to start thinking about how we can ensure that our project can be utilized and further developed for the future.

Our team is in a unique situation where, fortunately for the Artisan Farmers’ Markets, a new group of LFS 350 students will be taking on a similar project in 2018. Thus, we will be able to pass on our project to this new group without having to worry about whether or not our efforts will be abandoned. This reality gives us comfort, but also requires that we recognize our responsibility to ensure that our project is useful for the farmers’ markets general manager and for the new team of students when setting up their project to collect customer data in January.

In terms of an exit strategy with the Artisan Farmers’ Markets Society, there is not much we will be able to do to ensure that the work that we have done will be actioned by staff. However, we can ensure that the way in which we present our findings to the society is clearly actionable. We will try to make sure that we present our infographic and report with clarity and provide an analysis that combines reflections with recommendations. In this way we hope that the general manager will be able to use our report to guide her in developing the society’s next steps.

Similarly, we need to make sure that our report is also useful for the next student team coming in. These students will have access to all of our final results (infographic, surveys, blog, report) to help them shape the second part of the project. However, it would be best for us to develop a method to pass on how we got to where we did. To make sure this group can get off to the best start possible, we will make sure that our blog is reflective of every step we took during this community based learning project and that the general manager is also familiar with what methods worked and didn’t work for us. We hope that a deep reflective conversation with our community partner will help her to guide the next group to avoid the mistakes we did.

All in all, we have had a successful run so far and are excited to bring all that we have gathered together for our final presentation.

Strategies for a Graceful Dismount

Task 1: Find common themes from our interview data and connect the dots

Task 2: Work on group cooperation and communication

(Week 8-9)

    • After transcribing recordings/interview responses, start categorizing data and look for supporting quotes that give the report credibility;
    • Begin discussing commonalities among the compiled data for analysis that supports a conclusion and gives us the insight on next steps; and,
    • Team working meeting  –  Cold call and email randomly selected vendors to complete survey 
    • Keep all group members engaged and participating when discussing trends.

(Ongoing)

    • Ensure that all group members are informed and on-top of our research;
    • Keep group members caught-up with new data entries, ideas, correlations, conclusions, and discussions; and,
    • Keep up with deadlines to ensure the project is following the timeline and to resolve and obstacles that arise.