We’re just about at the end of our project journey! Thanks for following us thus far and we’re so excited to share what we’ve found out during our project.
Objectives
| Dates | Objectives |
| March 26th: Infographic presentation | Finish analyzing data and making an infographic |
| March 26th: Infographic presentation
|
Finish preparing for our presentations and sharing what we’ve learned over the term with our peers, community partners, TAs and instructor |
| April 6th: Last day of the term | Reflect upon our progress throughout the term and complete our charts for emotional and skills assessment |
| April 6th: Last day of the term | Complete our final project report
|
Achievements
- Met weekly to analyze our data and also met with our community partner via a video call to talk about our infographic and data results
- Completed our emotions and skills charts
- Met with our group members the day of the presentation to prepare for the infographic presentations in the lower atrium
- Invited our community partner to our presentation and to view other peers’ presentations
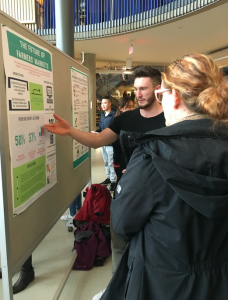 Jeff explaining the infographic to Heather (our community partner from BCAFM)
  Jin and Jeff speaking to our peers about our project
 - Learned about other people’s projects
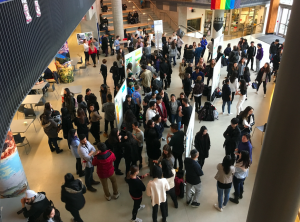
Hearing about each others’ work was very interesting!
- Began working on our final report
Summary
In our collaboration with the British Columbia Association of Farmers’ Markets (BCAFM), our study involved initiating a project to support the viability of new farmers into the BC farmers’ market system. Statistics Canada (2017) has found that the ages of farmers are continuing to increase. We were curious to explore the issues around the aging demographic of farmers in British Columbia, which may make adequate vendor participation increasingly difficult for farmers’ markets in coming years. We wanted to know why and how many people were leaving the farmers’ markets and what was preventing new farmers from replacing the outgoing ones. We hope that a greater understanding of these trends related to farmers’ markets vendors will assist the BCAFM in ensuring adequate vendor participation. We created a survey to collect quantitative data on the estimated number of farmers planning to leave the farmers’ markets in the next ten years, and qualitative data to find out about the barriers that made staying in or entering into farmers’ markets difficult.
In order to aid the flow of new farmers into BC farmers’ market, we established the
following objectives, as found in our proposal report:
• Objective 1: Quantify the number of farmers entering and exiting the BC farmers’ markets.
• Objective 2: Gain a greater understanding of a) existing barriers for new entrants entering the farmers’ markets, and b) reasons existing farm vendors plan to leave the market.
• Objective 3: Analyze demographic trends from survey participant responses.
We reached these objectives by creating a survey to quantify the number of farmers entering and exiting the BC farmers’ markets by asking questions such as “when do you see yourself leaving the farmers’ markets?”
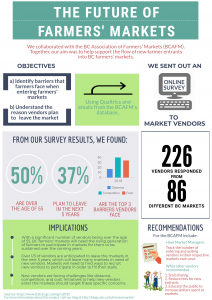
We also asked questions in our survey related to existing barriers that farmers’ market vendors saw or experienced for new entrants trying to enter the farmers’ markets, as well as questions to gauge reasons why farmers were planning on leaving farmers’ markets. Here are some of our main findings, which we compiled into our infographic:
To enlarge, please click here
As seen in the infographic, some of the trends we noticed include:
- 50% of the survey respondents are over the age of 55
- 37% of the survey respondents plan to leave the market within the next 5 years
- Distance, time, and competition were the top 3 barriers vendors face in farmers’ markets
However, we only spoke to vendors who were currently participate in farmers’ markets. We did not speak directly to farmers who do not currently participate in farmers’ markets but may want to in the future. Also, our results would have been stronger if we could have heard from more vendors in general, which would have made our data more representative of the entire BC farmers’ market vendor population.
Our community partner was pleased with the geographic distribution of vendors we heard from in our survey. We received responses from vendors from 86 out of 140 BC farmers’ markets.
We recommend for the next LFS group to go through our raw data in greater depth as well as to create a survey intended for the Young Agrarians community to gauge numbers for those intending to enter farmers’ markets. We would also encourage the BCAFM to develop a tool, such as an electronic vendor membership platform, that would automatically track vendor participation rates and trends. Another idea is to standardize the registration procedure for all markets so that a potential vendor can register for multiple markets at the same time, which would facilitate greater vendor participation.
Community Partner Feedback
At the end of our project, we checked in with Heather and Melissa and invited them to our infographic presentation to hear our and other project summaries. We shared with them our findings from the survey that we conducted. Heather did not seem surprised to hear about what we found in terms of numbers of farmers leaving the farmers’ market system, and was happy that our findings confirmed what the BCAFM had thought were the trends. Unfortunately the survey responses were primarily from existing market vendors, so we were unable to provide Heather with data that better represented the new and upcoming market vendors that she hoped to hear from as well. Heather suggested that future data collection should target the new or future market vendors, through programs like Young Agrarians, in order to understand their circumstances when trying to enter a BC farmers’ market. She was excited to have tangible research to be able to present to the rest of BCAFM, and to market managers across the province.
Food Justice
Throughout the course of LFS 350, we wanted to focus on food justice to see how the BC farmers’ markets system contributes (or fails to contribute) to food justice. One principle of food justice includes the design of exchange mechanisms that encourage community reliance and control (Cadieux and Slocum, 2015). The infrastructure of a farmers’ market allows for the circulation of local goods within a community, increasing the self-reliance of a community, and potentially contributing to food sovereignty via the selling of fresh and sustainable produce. However, issues pertaining to food justice do exist in BC farmers’ markets.
For consumers, alternative food systems (such as farmers’ markets) may be worse than conventional food systems at ensuring that low-income consumers have access to healthy food, due to their “tendency to attract a white and upper-middle-class clientele” (Hodgins & Fraser, 2018, p. 149). Link and Ling (2007) found that there can be a lack of accessibility for less affluent consumers at certain farmers’ markets if the markets’ emphasis is on speciality, exclusive, and high-priced niche products.
There are clearly some shortcomings in terms of consumer access (that is, not all people are able, due to economic or other reasons, to shop at farmers’ markets) and there also may be food justice shortcomings in terms of vendor participation.
According to our survey, over 90% of BC farmers’ markets are White. Other ethnic groups are not equally represented at these markets, which calls for consideration regarding any social injustices that may act as barriers for them to enter into farmers’ markets. These barriers could span a large spectrum of injustices, including greater distance from markets, or challenges in accessing land or farming infrastructure. Social injustices that limit the participation of people of different ethnicities at farmers’ markets should be acknowledged and addressed with initiatives to reduce these barriers to make it a more inclusive space. As described in the findings of Gibb and Wittman (2013), it is also true that many people of colour in British Columbia use parallel food networks that are already highly successful, and therefore do not need to participate in BC farmers’ markets.
Farmers’ market stakeholders should acknowledge that farmers’ markets are disproportionately guided by the voices of White British Columbians. As a result, participants in farmers’ markets, when talking about the local food movement, should seek to acknowledge, consider, and listen to the voices associated with parallel local food movements that may be more representative of other communities. This could be achieved by further implementing an Asset-Based Community Development framework which seeks to include diversity within communities (Mathie & Cunningham, 2003).
Over the course of this term, we’ve all learned more about food justice, and how the inequalities in class, gender and ethnicity affect opportunities in the food system and engaged in asset-based community development.
Moment of Significance
What
We had just gotten back from our trip to Victoria to attend the BCAFM Conference. We had spent the weekend networking, attending workshops, and talking to vendors and market managers about our project in collaboration with BCAFM, and to encourage them to complete our survey and to forward it to our target demographic- farmers’ market vendors. We were therefore initially surprised to receive feedback from a community partner who felt that we had missed opportunities for networking during Saturday’s dinner. We felt a little taken aback at this feedback because we felt that we had done our best during the weekend. For most of us, it was our first official conference networking event. In addition to manning our booth and talking to market managers and vendors, we also attended as many general meetings and specialized workshops as possible, so we all felt that we had done our best to make the most of the conference.
So What
This constructive criticism was significant for us because it gave us a good reminder of the importance of networking and building connections. It gave us a taste of what it might be like in the real world and as to how we should take criticism. It made us come out of our comfort zone and forced us to look at different perspectives whilst making us feel vulnerable.
Upon reflection, we realized that the community partner was not trying to make a negative comment about our group, but rather trying to help us make the most of our networking opportunities in the future. We realized how tired we were during Saturday dinner, and were we to have more energy, we could have been speaking more with the other attendants of the event. Steph advised us that “additional perspective can always be gained by speaking with and listening to a range of voices beyond the target group, which is good advice for research and life in general.” Will followed with an emphasis that this was positive constructive feedback and served as a good reminder for us that we should “make hay while the sun is shining,” even though events such as conferences might be exhausting. He said that while at a conference, we are part of a public performance, through which our actions and behaviours are judged by other people. He emphasized that at these events, we would have the opportunity to speak with people we normally would not be able to get ahold of, all in one room albeit. We now see the comments from the community partner as constructive criticism, and a way to point us towards future improvement and a nurturing relationship.
Now What
Our project and the feedback from the community partner allowed us to gain professional development and also prepared us for future networking and conferencing opportunities. We now know to better prepare for future conferences and to make the most out of every opportunity available. Having received a fair amount of constructive feedback from our community partners, Steph, and Will, we are getting better each time at taking the advice and using them to improve our work.
Updated Emotions and Knowledge Graphs
In our previous blog post, we created two graphs- one that represented our emotional confidence and one that represented our knowledge gained from the beginning of the semester, until the process of launching our survey. Since launching our survey, we have continued adding to these graphs. Both the emotions and knowledge graphs can be seen below:
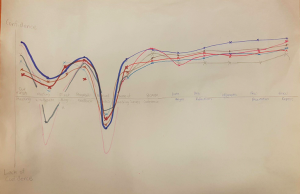
Figure 1: Emotions Graph
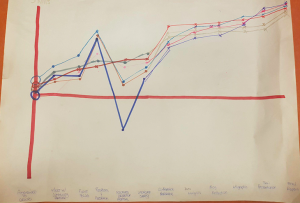
Figure 2: Knowledge Graph
Click here for a larger view
Farewell
Thank you so much for coming on this journey with us, we hope you enjoyed our projects and personal developments as much as we did. For now, farewell!
References:
Cadieux, K. V., & Slocum, R. (2015). What does it mean to do food justice? Journal of Political Ecology, 22, 1-26.
Gibb, N., & Wittman, H. (2013). Parallel alternatives: Chinese-Canadian farmers and the Metro Vancouver local food movement. Local Environment, 18(1), 1-19.
Hodgins, K. J., & Fraser, E. D. (2018). “We are a business, not a social service agency.” Barriers to widening access for low-income shoppers in alternative food market spaces. Agriculture and Human Values, 35, 149-162.
Link. A. & Ling, C. (2007). Farmers’ markets and local food systems. Retrieved from February 25, 2018 from https://crcresearch.org/case-studies/crc-case-studies/farmers-markets-and-local-food-systems.
Mathie, A., & Cunningham, G. (2003). From clients to citizens: Asset-based Community Development as a strategy for community-driven development. Development in Practice, 13(5), 474–486.
Statistics Canada (2017). 2016 census of agriculture. Retrieved March 22, 2018 from https://www.statcan.gc.ca/daily-quotidien/170510/dq170510a-eng.html.