As part of a ski development analysis for Garibaldi Resort in Squamish, I was asked to create 2 maps outlining the potential impacts on the environment (i.e. the ungulate winter habitats, old growth management areas) and the potential elevation/hill shade (such as the snowline contour, which is determined as 555m). The consequential assessment is essential in analysing environmental risks, natural hazards, as well as affects on the development and the land itself.
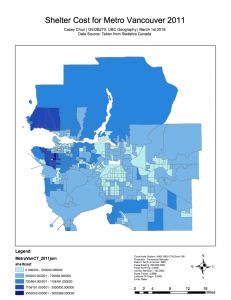
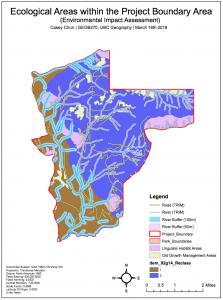
Map 1: Map of Ecological Areas (preserved areas) in the proposed project area of Garibaldi Resort
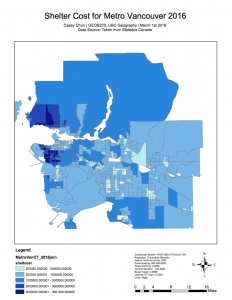
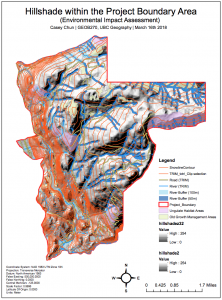
Map 2: Map of Hillshade, Contour and Elevation in the proposed project area of Garibaldi Resort (including snowline contour, and the previously illustrated ecological areas)
Full resolution of the maps can be found below:
- Map 1 – Ecological Areas within the Project Boundary Area
- Map 2 – Hillshade within the Project Boundary Area
I was also asked to include a 1-2 page memo report on my findings, analysed results and processes in compiling these maps. The report also included recommendations based on what I evaluated, and suggestions for other potential studies (i.e. climate change/temperate changes). Here is the report below:
Memo Report:
Whilst analyzing the proposed development of Garibaldi Resort on Brohm Ridge (at Squamish), there are a number of analysis results that are worth evaluating prior to construction. Many of them included potential threats to ecological areas, certain environmental threats and impact from hill elevation. Throughout the course of this report, I will aim to outline all the potential implications to Garibaldi Ski Resort development in 2018.
In order to generate a comprehensive analysis to identify necessary components for an environmental impact assessment, there were a number of steps I undertook in order to acquire and verify the data. First, I gathered open sourced data from DataBC (specifically Ungulate Winter Range and Old Growth Management Areas), as both layers indicated the areas covered under the Forest Practices Code, Forest Ranges Practices Act and forest licenses found under the legally established Old Growth Management Areas. These layers would thus provide necessary information on ecologically preserved habitats and conserved old growth forest regions. I then made use of data outlining the project boundary, the digital elevation, contours, park boundaries, roads and rivers of the site. As a number of these layers made use of different co-ordinate systems, I configured the main data frame coordinate system as NAD 1983 UTM Zone 10N – hence, the resulting maps would be projected the same way. For the next step, I calculated the areas lower than 555m (i.e. elevation at 555m would be deemed as the snowline contour) in order to identify the areas which have limited snow availability and thus not be suitable for a ski resort. I also studied the regions that would be omitted from the construction of the resort, including the old growth forest, winter habitats and fish bearing streams found in Brohm Ridge (it is critical to note that these areas are legally protected, thus construction is completely restricted). As a final step, I constructed two maps, one outlining the ecological areas under protection (as aforementioned above) and another depicting the elevation (using hill shade/contour) and its impact on those ecological areas.
After thorough quantitative analysis, my results outlined the possible areas for development and the impact on certain protect areas (as outlined below):
| Type | Area (sqm) | Area of Project Boundary Area | Percentage of Project Boundary Area (to 3 significant figures) |
| Project Boundary Area | 54717275.030137 | / | / |
| Below Snowline Contour (under 555m elevation) | 16371095.01165 | 0.299194267306498 | 29.9% |
| Old Growth Forest/Management Areas | 3710331.429332 | 0.067809141213418 | 6.78% |
| Ungulate Habitat Areas (Mule Deer species) | 2317859.136008 | 0.042360646335757 | 4.23% |
| Ungulate Habitat Areas (Mountain Goat species) | 1997299.753625 | 0.0365021787457 | 3.65% |
| Total Ungulate Habitat Areas | 7.88% | ||
| Fish Bearing Streams (50m) | 8006619.665446 | 0.146327090686 | 14.63% |
| Fish Bearing Streams (100m) | 7588594.574394 | 0.138687362816 | 13.86% |
| Total Fish Bearing Streams | 28.49% | ||
As illustrated in the table, the areas below the snowline contour (i.e. under 555m elevation) is presumed to have limited snow availability. Thus, 29.9% of the project boundary area is not suitable for ski resort construction as it is under the 560m elevation line. The old growth management areas (mostly forest areas), retain 6.78% of the overall project boundary area, whilst ungulate habitat areas – in both mule deer and mountain goat species, consist of 4.23% and 3.65% respectively. Consequently, equating to a total of 7.88% of ungulate habitat areas within the proposed project boundary. Fish bearing streams would also need to be taken into consideration during development, as the river buffer of protected fisheries (i.e. protected lakes/streams) make up a total of 28.49% of the project boundary. Notably, regions below the snowline contour and fish bearing streams would make the most impact to potential areas for the ski resort. Though both ungulate habitat areas and old growth management areas should not be undermined, as it also makes a significant contribution to ecological areas, totaling to 14.66%.
From the findings in this report, there are a number of recommendations that I would like to recommend for Garibaldi resort. As seen on the map showcasing the ecological areas under protection by Canada’s legal board, a number of the old growth management areas and ungulate habitat areas coincide with the proposed project boundary areas (especially on the regions with snow – above 555m/ the snowline contour). There are also a number of fish bearing streams (according to the river buffers), which would need to be accommodated during allocation of certain ski amenities. Thus, it is critical to select a location that does not intersect with any of the previously mentioned ecological areas. Perhaps, certain areas could be introduced as part of a tourist attraction or part of a resort activity. For instance, fish bearing streams could be utilized as a fishing activity (although further data has to be gathered on the level of protection for those particular fish species). Likewise, ungulate winter habitats and old growth forest management areas could also be incorporated as the natural scenery of the resort, with strict rules outlining the limits of the boundaries to ensure the wildlife area is well protected. Transportation systems and road networks are not an issue for the ski resort, as there are an abundance of roads interconnecting the project boundary area. Whilst examining the second map of hill shade within the project boundary area, it is critical to note much of this elevation may interchange throughout seasons (as a consequence of climate change and seasonality), i.e. the snowline contour may depreciate or there are substantial risks of avalanches. Thus, resort infrastructure/facilities would need to accommodate for these natural shifts and ensure the safety of visitors and the neighboring animal habitats. The proposed resort should also avoid any elevation below 555m, as this would pose certain risks due to fluctuating and unstable climates.
I believe that the two most major environmental factors to ski resort development are the ongoing affects of climate change, and the eradication of the ecologically preserved areas. As climate change is particularly unstable and consistently fluctuating, it has become difficult and risky to plan ski resorts – a tourist attraction that is entirely dependent on the provision of cold climates. Thus, they should be considered the most major concerns for the project. In order to address these concerns, I propose that a number of other analysis reports to be investigated before proceeding with the Garibaldi resort development. Including those of seasonal temperature changes throughout the area, potential impacts by transportation (e.g. how would continuous trips by public transport/private vehicles contribute to emissions, or how these vehicles would affect the landscape?), land slope stability (in order to identify avalanche/natural hazard risks, as well as potential sites for structural construction), annual snowfall (to analyze the density of snow coverage and thus provide better preparation), potential tourist density/maximum capacity for the resort, as well as annual changes to the snowline contour (indicating the affects of climate change). All of these evaluations would provide a more extensive outlook and a more efficient environmental impact assessment.