About Cathy Guo

B.A at WHU MFRE student at UBC, 2012-2013

London Congestion Charge: Policy Overview and Discussion

London Congestion Charge: Policy Overview and Discussion

Policy Overview

Traffic congestion is a common big issue in most of “big” cities and international cities with highly developing speed. The negative impacts of the traffic congestions, such as lower efficiency, longer waiting queue, increasing fuel wasting and air pollution, etc., and how to control traffic congestions are heated discussed in academic research during the past decade. United Kingdom, one of the developed countries levy congestion charge, published a UK government sponsored document in February 2003 to public that the government introduced the London Congestion Charge (LCC) in the Congestion Charge Zone (CCZ) (Fig.1)  in central London,  and the Department for Transport would take this responsibility, and stated that their goal of this congestion charge is to improve the traffic efficiency in London and increase the investment supporting for London’s transport system.Fig.1 Map of CCZ – 2011

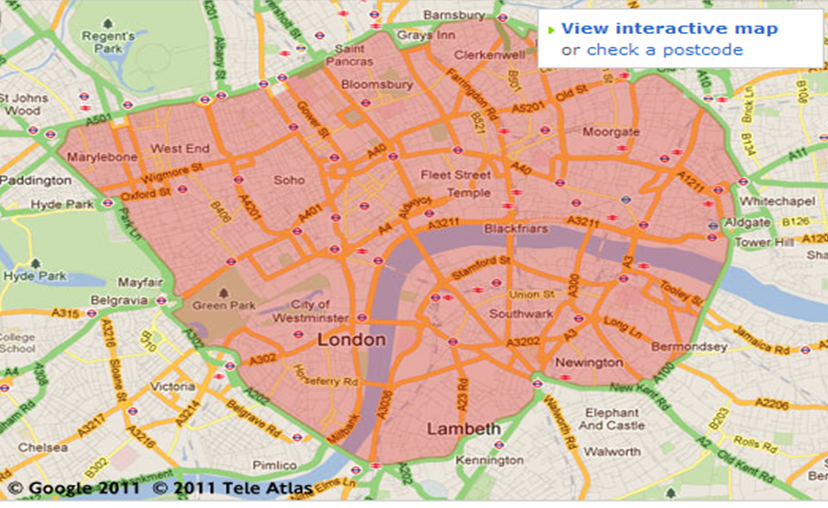
  *Source:TFL” http://www.tfl.gov.uk/tfl/roadusers/congestioncharge/whereandwhen/”, Retrieved on 21st, March, 2013

The LCC fee is charged from Monday to Friday each week, 07:00 a.m. to 18:00 p.m. each day upon motorists operating in CCZ, and “no charge on weekends, public holidays, between Christmas Day and New Year’s Day inclusive, or between 18:00 p.m. to 07:00 a.m.” [1] The LCC is £5 per day per motorist when this policy was introduced, and it increases to £10 per day now. There are exemptions – “vehicles such as emergency service vehicles and Black cabs licensed with Taxi and Private Hire (TPH) can drive in the zone free”. [2] The CCZ covers about 136,000 residents in London. There are a temporarily expansion of CCZ from February 2007 to January 2011 to include the western London – called western extension. But it was cancelled after a large public consultation in 2008, which showed that about 67% of London residents and 86% of business disliked this extension.


Discussion

(I) Implementation evaluation. According to the Transport for London official website, there is “a 6% increasement in bus passengers during the charging hours” and “all net revenue raised by this charge (£148million in financial year 2009/2010) has to be invested in improving transport in London, by law.” [3].


It seems that the government evaluate this policy success in the aspect of increasing traffic flows. However, since the unclear statement here (they don’t point out the increasement happens in busy period or leisure period). Thus, using the “raising usage of public transportation” as an evidence, I could not conclude that the congestion reduce. An important indicator of the traffic flows is the average traffic speeds. If the government could show that the average vehicle speeds in CCZ during busy hours increase by 6%, then I could conclude that this policy do reduce the traffic. Leape (2006) summaries that the number of private cars, vans and trucks coming into CCZ dropped by 27% between 2002 and 2003. To the best I could do, there is no persuasive paper for the latest data.


Since the UK keeps a nice developing speed in the previous years, and the statement of “increases in congestions” on TFL official website, the best guess I could made on the policy implementation after 2011 is that the policy succeed at the early years after it was introduced, then the traffic flows level has dropped back to pre-charging level  due to the increasing of income, and reducing of the road capacity.


(II)  Tax revenue.  According to the government’s statement of the policy revenue, the net tax revenue would be used to increase the transport system in London. I could not find the financial year book talking about how they invest the net revenue and the outcomes of this investment. And due to the financial crisis in EU area, the indicators of the transportation systems would be affected by other economic factors. Leape(2006) points out that there is a shortfalls in the tax revenue because of unexpected operation cost, and some 80% have been invested on bust network improvements in 2003-2004 and further 11% expense on road safety; and the annual social total cost in 2005 ( when LCC is £5) is £163 million while the annual social total benefit is £230 million. This findings implies that the policy shows an improvement in both private and social sections. And the Wikipedia of LCC shows that the net revenue increased continuously from 2004 /05 to 2006/07. However, the financial crisis and the lack of latest data could not support this conclusion after 2011. To my best knowledge, I could only say that if they continue the investment and the LCC fee ( £10 per day now) is still reasonable – neither too high nor too low, the social and private would both benefit from this tax revenue via the improvement of public transportation.


(III) Distributional effects. In part, I would focus on the air quality, parking issue, traffic accident rate and traffic speeds instead of income of poors and riches. I would separate the London as CCZ and Non-CCZ areas, the difference is that the Non-CCZ area does not have LCC ( include the western area since the extension has been opposed.)


As the policy review at the beginning of this blog, the CCZ locates in the central of London – the busy area and central of a capital city. The LCC would help to control the traffic congestion level within the CCZ via raising the individual opportunity cost of entering the CCZ. Theoretically speaking, the raising individual opportunity cost could make the total private cost convergence to the total social cost. Using the typical Gornor fishery model, regarding the fishery capacity as the road capacity, the effort as the entering vehicle, we could obtain an optimal allocation consisted of the entering vehicle level and the capacity level. In this optimal allocation, the CCZ would have a better statue compared with no-policy.


However, in Non-CCZ areas, series of problems would appear. People who value the time higher than LCC and parking fee in CCZ would continue to drive into CCZ in busy hours, and others who do not willing to pay the LCC and have a lower value of the time would choose public transportations. The “middle” part, covered most of middle-income level family, they could not support LCC and expensive parking fee in the central London, but value the time, would choose to drive to the boundary of CCZ and switch to public transportation system. With these actions, the burden of public system inside CCZ would higher, the parking fee around the boundary of CCZ would increase, and the potential traffic congestion in the boundary area would appear. If the government could not solve these problems efficiently, the new traffic congestion around the boundary area would raise the traffic congestion level inside the CCZ. And the CCZ would enlarge continuously with the same problem.


Talking to the traffic accident, the LCC higher the opportunity cost of cars, people would switch to either public transportation options or other vehicles that are not charged. Daniel J. Graham et,al. (2012) use the difference-in-difference model integrated with Poission and Negative Binomial regression model to test the regional effects of LCC, and concludes that this policy reduces the total car accidents but increases the two wheels vehicles accidents


In my opinion, the optional strategy is the area-based LCC. TFL could set different level of LCC in different CCZ. Individuals would select their affordable LCC. The burden of public system could be spread out as well. The supporting theorems of my suggestion are partial equilibriums and incentive mechanism. It looks like a government sponsored firm uses the price discrimination to achieve a better allocation.


By

 Catherine Guo

 (The author shows grateful to suggestions of policy selection from best friend Rayla Liu, 2nd year Ph.d student of UVA)


Reference:

[1]Transport for London (TFL), http://www.tfl.gov.uk/tfl/roadusers/congestioncharge/whereandwhen/, Retrieved on 22nd March, 2013.

[2]Transport for London (TFL), http://www.tfl.gov.uk/roadusers/congestioncharging/6713.aspx, Retrieved on 22nd March, 2013.

[3] Trasnport for London (TFL), http://www.tfl.gov.uk/roadusers/congestioncharging/6723.aspx , Retrieved on 22nd March, 2013

[4] London Congestion Charge (LCC), http://en.wikipedia.org/wiki/London_congestion_charge#Effects , Retrieved on 22nd March, 2013

[5] Leape Jonathan, The London congestion Charge, Journal of Economic Perspectives, Volume 20, No.4, Fall 2006, pp. 157-176

[6] Daniel J. Graham, Haojie Li, Arnab Majumdar, The Effects of Congestion Charging on Road Traffic Cusualities: Analysis Using Difference-in-difference Estimation, Accident Analysis & Prevention, Volume 49, Nov. 2012, pp.366-377


Waste Disposal Levy in New Zealand


According to the official statistics data, New Zealanders send around 3.2 million tonnes of waste material to landfill. On 25, September, the Waste Minimisation Act 2008 (the Act) was encouraged to put levy. Since July, 1st, 2009, the Act is allowed to puts a levy on waste disposed of at landfill in order to help the communities and businesses address New Zealand’s waste issues.  Under the Act, a $10 per tonne levy on ALL waste sent to landfill – charged via disposal facility operators. The main purpose of the levy is “to create funding supports for waste minimisation initiatives and provide an economic incentive to polluters to change their behaviour” [1]. More precisely, half of the levy income will go to territorial authorities – city and district councils – to spend on activities promoting or achieving the goal of minimizing waste; while the other half would be set up as a waste minimisation fund to support a set of criteria established waste minimizing projects after subtracting the administration fee.

In my opinion, this landfill tax could be regarded as a Pigou tax, since it increase the cost of negative externality and try to correct the market. Theoretically speaking, the tax could be an effective and efficient policy, for the increasing of marginal private cost cancel off the difference between private and social cost. And if this allocation is achieved successfully, this landfill tax would be neutral tax, since all the tax revenue is used to promote related R&D activities and pay back to residents via future utility increasing.

In ideal situation, the coverage is good because it cover all the waste sent to landfill and no exemption. But in reality, in my opinion, we should worry about the existence of potential ignored part. According to the official document, it is said that they cover all the waste SENT to landfill. We should think about the part that not sent to the landfill. For instance, some householders or business would illegally dump their waste to forestry area or ocean or any place not used as landfill in order to get rid of the $10 per tonne, especially when they are facing huge amount of waste, because the tax payers could transfer the levy fee to householders and business; or some facility operators reduce their waste amount, etc. Though they said “decreasing rate of illegal dumping” [2], the reason they supply is not convinced enough because of the sample size, uncompleted questionnaires and unclear respondent group distribution – there may be some sample selection problems. Thus without detail data, I could not agree that the coverage of this tax is great.

According to the 2011 Review report:

Revenue: three quarter  ( from Jul 09 to Dec 10) $31,212,658
Cost: Administration cost three quarter   $2,477,123
Cost: Funded territorial authorities three quarter   $900,000
Cost: Funded Projects ( three quarter) $6,536,641 **
Net $8,225,612

*Data source: collected from [3].                 **Not all funding allocated because of not enough application.

Through the briefly inflow-outflow table above, we are not sure whether this policy is revenue neutral or not. Lack of the information about the $8,225,612 spend, all I could conclude now is that the funding remaining in a large amount. And due to the statement in Review report that “there were not enough applications of sufficient quality to qualify for funding” and “not 100% support the project cost”[3], we are not sure that this large amount of money would be all allocated to increase the taxpayers’ future utility.

The landfill levy rate is $10 (plus GST). According to the official document, they claim that this is a good rate and they would not change the rate. They set this rate because this amount “i) it is less likely to result in behaviour such as illegal dumping, ii) reduces the impact on businesses and households, iii)reduces the risk of inefficient spending of revenue; iv)allows the effects, both positive and negative, resulting from the levy to be assessed”[2]. In my opinion, this rate would have some problems. It probably helps increase the marginal private cost to the level of marginal social cost. But due to the 2011 Christchurch earthquake, the large destroy happened in the second largest city of New Zealand. I search the data for the same three quarters as 2011 Review – it shows that the inflation rate in New Zealand increased from approximately 1.9 at 2009 to 4.6 at 2011 [5]. We don’t know the slope of growth rate of marginal social cost and marginal private cost, thus we are not sure that after the large jump of inflation rate, the $10 would still be high enough to cover the difference. Unfortunately the latest update of official website of this policy is Feb 23, 2011. Thus I would say that they should change the levy rate rather than set it unchanged.


References:

[1] Official website of Ministry for the Environment of New Zealand: here

[2] Waste Disposal Levy FAQs: here

[3] Review of the Effectiveness of the Waste Disposal Levy, 2011: here

[4] 2011 Christchurch Earthquake: here

[5] New Zealand Inflation Rate (Annual change on CPI): here


Catherine Guo

Master of Food and Resource Economics

University of British Columbia


Carbon Policy Analysis Report – BC Carbon Tax

Tax Overview

The carbon tax of British was effective on July 1, 2008 cross BC province at a starting level of $10/tonne, and designed to increase by $5/tonne every yearly till $30/tonne at July 1 2012. The B.C’s Ministry of Finance estimated that this tax would reduce CO2 emissions by up to three million tonnes yearly in 2020 – equivalent strategy of taking off 800,000 cars from the road each year. [1]  It is a “Revenue Neutral Carbon Tax”, which means that all the carbon tax revenue would transfer back to tax payers via reductions in other taxes, such as personal income tax.  According to the government report, “no further increases or expansions are planned at this time”.[2] This tax would be based on greenhouse gas emissions (GHG) generated from burning fuels, as general case, puts a price on purchasing or using each tonne of GHG emitted.  Intuitionally, increases the emission price, then reduce the emissions via market itself and form an automatically functioned incentive mechanism to encourage the R&D of fuel usage.

The application and collection method of this tax is almost the same way as motor fuel taxes[3] currently applied and collected, except for the natural gas – collected at retail level. This is a minimum administration cost for government and compliance to those tax collectors on behalf of provincial government. Table 1 shows the selected carbon tax rates by fuel.


Table 1. Selected Carbon Tax Rates by Fuel 
 

UNITS FOR TAX

TAX RATE JULY 1, 2012

Gasoline

¢/litre

6.67

Diesel (light fuel oil)

¢/litre

7.67

Jet Fuel

¢/litre

7.83

Natural Gas

¢/cubic metre

5.70

Propane

¢/litre

4.62

Coal – high heat value

$/tonne

62.31

Coal – low heat value

$/tonne

53.31

*Data source: http://www.fin.gov.bc.ca/tbs/tp/dimate/A4.html
**For more carbon tax rates: http://www.fin.gov.bc.ca/tbs/carbon_tax_rates_by_fuel_type_from_Jan_2010.pdf

To summarize here, the object for this carbon tax is: i) to reduce CO2 emissions, ii) to archive the goal of “Revenue Neutral Carbon Tax”. In general tax case, there should be a third goal – reducing the market distortion.


Tax implementation

Reduce CO2 Emissions

Usually, the reduction of CO2 emissions could be measured by the fuel consumption.  The government supplies an attractive saving matrix on their website as suggestions to British Columbians. The research outcome on fuel consumptions shows that this tax is environmental friendly strategy.  The table 2 below shows a  briefly statement of consumption and emissions data.

Table 2  Brief of consumption and emissions data
B.C Rest of Canada
Fuel Consumption per head Dropped by 4.5% Declined, but less than 4.5% individually
Petroleum fuel usage Dropped by 15.1% Declined by 16.4%
Greenhouse gas emissions Dropped by 9.9% Declined by 4.9%

*Data source: http://www.carbontax.org/progress/where-carbon-is-taxed/


Revenue Neutral Carbon Tax

The carbon tax is designed as a resource of fund supported tax cuts in B.C., for individuals, families and business. The figure 1 below shows the revenue of carbon tax and reduction tax revenue on personal tax and business tax cuts. In calculating this table, the governmental department use the same material assumptions and policy decisions underlying it when they design this report. The only material assumption needed to specify for this report is that the cost of revenue reductions increasing with the upward trends of personal income tax revenue yearly, due to the personal income tax rate cuts.

Through this table, it is easily to see that in 2010/11 real data and 2011/12 forecasted data, the carbon tax revenue is 741 million CAD and 960 million CAD, both less than the total tax revenue reduction, which is 865 million CAD and 1,152 million CAD respectively, i.e. the revenue neutral carbon tax has been achieved.   And in the report, the forecasted carbon tax revenue for 2013/14 and 2014/15 is $1,241 and $1,261 million, and break even with tax revenue reduction respectively.

Thus, this goal has been achieved. And the report shows that this tax is socially efficient as well. I would illustrate this topic in following part.

Fig. 1  Revenue Neutral Carbon Tax Report 2010/11 and 2011/12


*Data source: http://www.bcbudget.gov.bc.ca/2012/bfp/2012_Budget_Fiscal_Plan.pdf, p.66
**For the material assumptions on revenue: Budget and Fiscal Plan 2012/2013-2014/2015, p.132-p.136


Socially Distortions Reduction

Usually, the government controlling is needed when market failure happens. The government has different options at CO2 emissions controlling, such as cap and trade, motor tax, purchased tax on fuel used commodities, etc. And within taxation, there are two kinds – one is on price, the other is on units, which is volume in fuel market. Tax on price would raise the prevailing price in market, which would result in additional cost for consumers and tax payers.

This carbon tax should be supported because it is a unit’s tax – they tax on volume not on price. It helps to lower the price fluctuation.  Why the fuel price volatility is so important? Because the fuel price is one of important indicators of inflation rate, or price level in a country.  If fuel price raises, the cost of production industry would increase as well, then the price of goods, especially non-durable goods would increase.  The government put a tax in order to put the social cost to firms’ private cost, such that they could reduce the production of pollution. However, if the market price increases, the firms would have enough space of revenue to offset the higher cost. Then things would not be big difference.

The fuel price in B.C. increases with the world fuel price, but no higher add-ups. And according to the yearly report, the inflation rate of B.C. tends to be stable.

What we need to notice here is the unemployment rate. As we discussed above, the tax would increase the cost of fuel usage. To firms, it would be a big shock. Let’s take car companies as examples. Besides the increasing of producing cost, the revenue would decrease because of lower consumption on cars – more people would choose to walk or public transportations instead of car driving.

The B.C.’s carbon tax does a good job on this side, through a yearly increasing amount of tax. And the report released on time for firms to made their plan, and allowed them some periods to adjust to this policy. If not, the higher tax rate would be a very big random shock to industries. The firms would do all they can to reduce the cost.

As to the distribution effect, I would think that there exists some effects but may be offset by another effective policy simultaneously.  This carbon tax is as a supported fund to personal taxes, one of these is benefit to low income person. Lack of the clear data for the income increasement of poor and the average price level, especially the price level for necessary goods, I could not be 100 percent sure about the distribution effects. But according to the paper I searched, B.C. has a low income tax rate compared with rest parts of Canada.


Reference:

  1. Budget and Fiscal Plan 2012/2013-2014/2015 , p.66 – p.68, p.132-p.136    http://www.bcbudget.gov.bc.ca/2012/bfp/2012_Budget_Fiscal_Plan.pdf
  2. 2.       A Carbon Tax is More Viable than Cap and Trade, Richard Matthews
    http://globalwarmingisreal.com/2012/07/25/a-carbon-tax-is-more-viable-than-cap-and-trade/
  3. 3.       Where Carbon is Taxed, Carbon Tax Center
    http://www.carbontax.org/progress/where-carbon-is-taxed/


[1] Data source: http://www.fin.gov.bc.ca/tbs/tp/climate/tax_cuts.htm

[2] Cited from Budget and Fiscal Plan 2012/2013-2014/2015, P66

[3] For the motor fuel tax collection: http://www2.gov.bc.ca/gov/topic.page?id=352CCA116A0D48E19C7613AA1F388B44

CAEXPO-Free trade region

It’s an old policy but long-term policy between South-East Asian countries and China. The trade region is settled down permanently at Nanning, the capital city of GuangXi Province, China.

Trade meeting is held annually. And what I hope to emphasize here is the free trade – zero tariff. Considering the good weather at Nanning and the harvest of fruits in South-East Asian, it creates more chances to connect and develop together among countries.

And that’s why I choose this program.

I would like to do a small research on this policy.

Here’s the official website:http://eng.caexpo.org/ab_caexpo/t20080324_78351.html