Sensitivity Analysis
Sensitivity Analysis | Scale-dependency and MAUP | Data Uncertainty | Lack of Data
A separate coastal sensitivity index was generated using the geometric algorithms utilized by the InVEST Coastal Vulnerability Model and compared to the results obtained from the arithmetic model used in this project (Cooper and McLaughlin 2010). The Minus tool was used to determine the difference between the two models by subtracting the geometrically-derived raster from the one presented under the results on a cell-by-cell basis.
Two separate sensitivity analyses were conducted to evaluate the sensitivity of the model to changes to its algorithm.
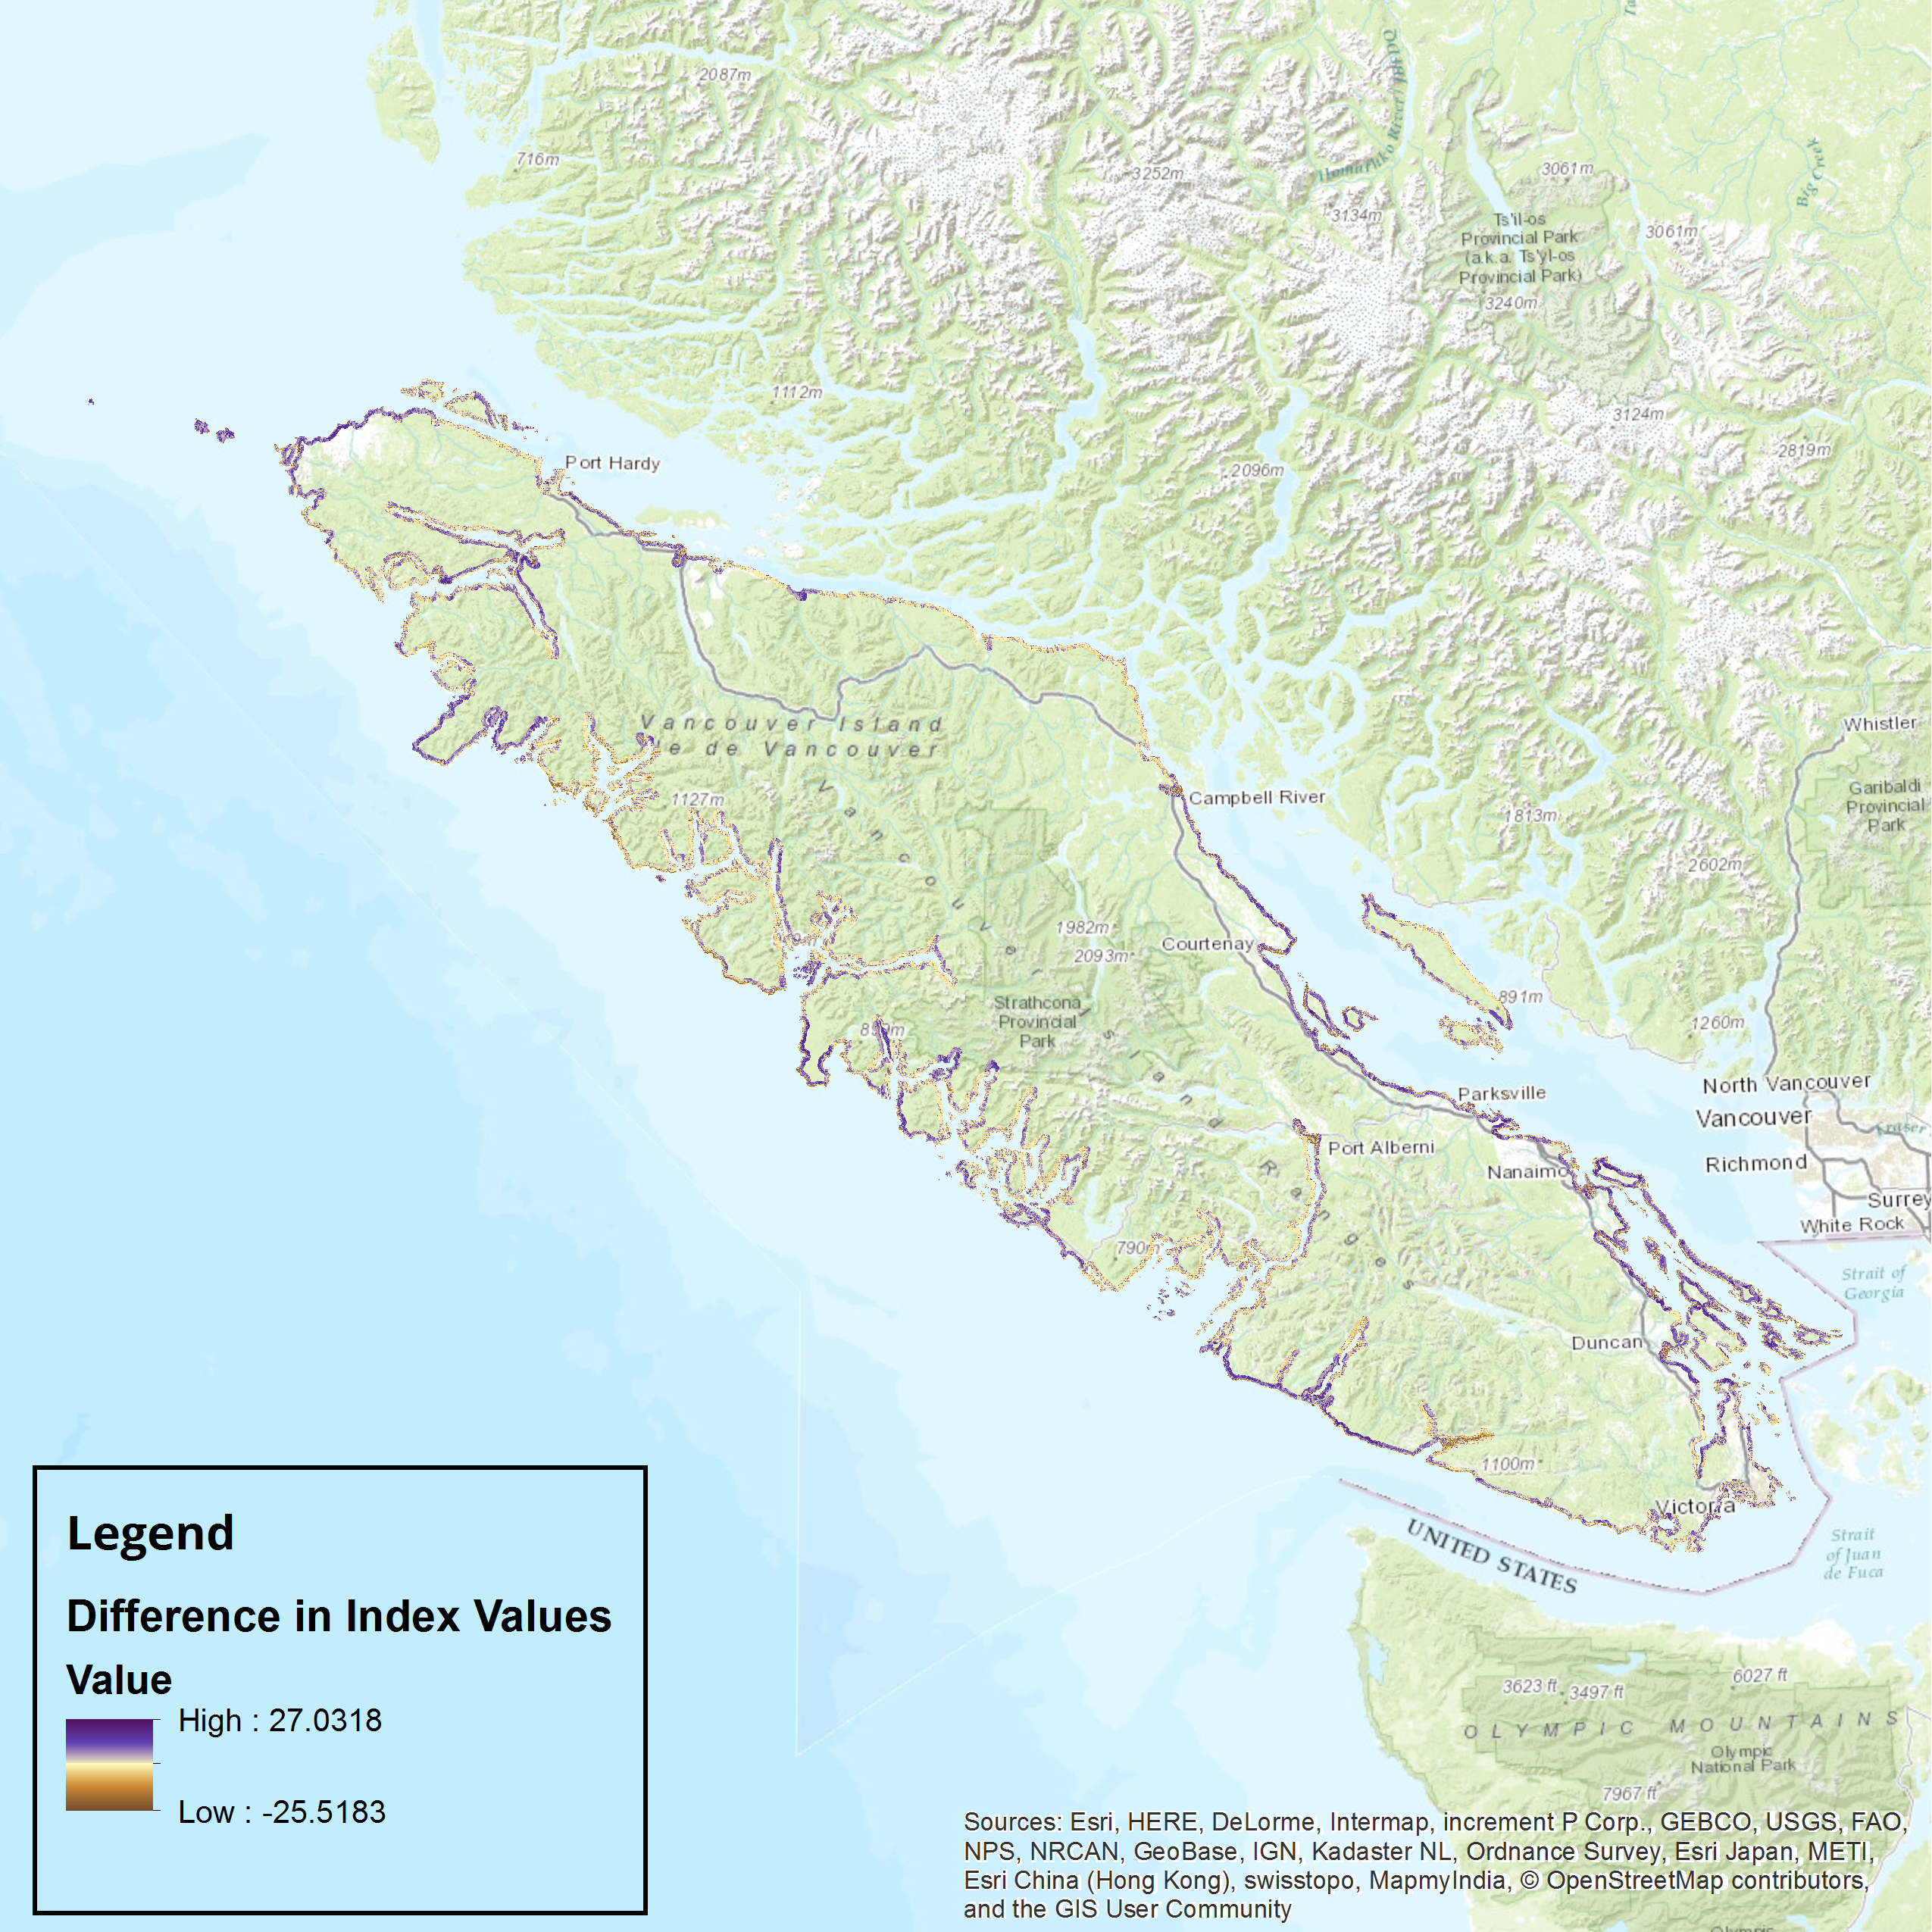
(1) The geometric algorithm was first used to obtain new physical and socio-economic sub-indexes, which were then combined together using the arithmetic average calculation for the final coastal sensitivity index. This new combined index was then compared to the index obtained through the model adapted from McLaughlin and Cooper (2010) by use of the Minus tool, the results of which are shown below.
There is a notable contrast in scores between the two generated indexes, with values differing by +/- 25-27%. The blue regions represent areas where the arithmetic model assigned higher values than the geometric model, while the orange regions represent the opposite.
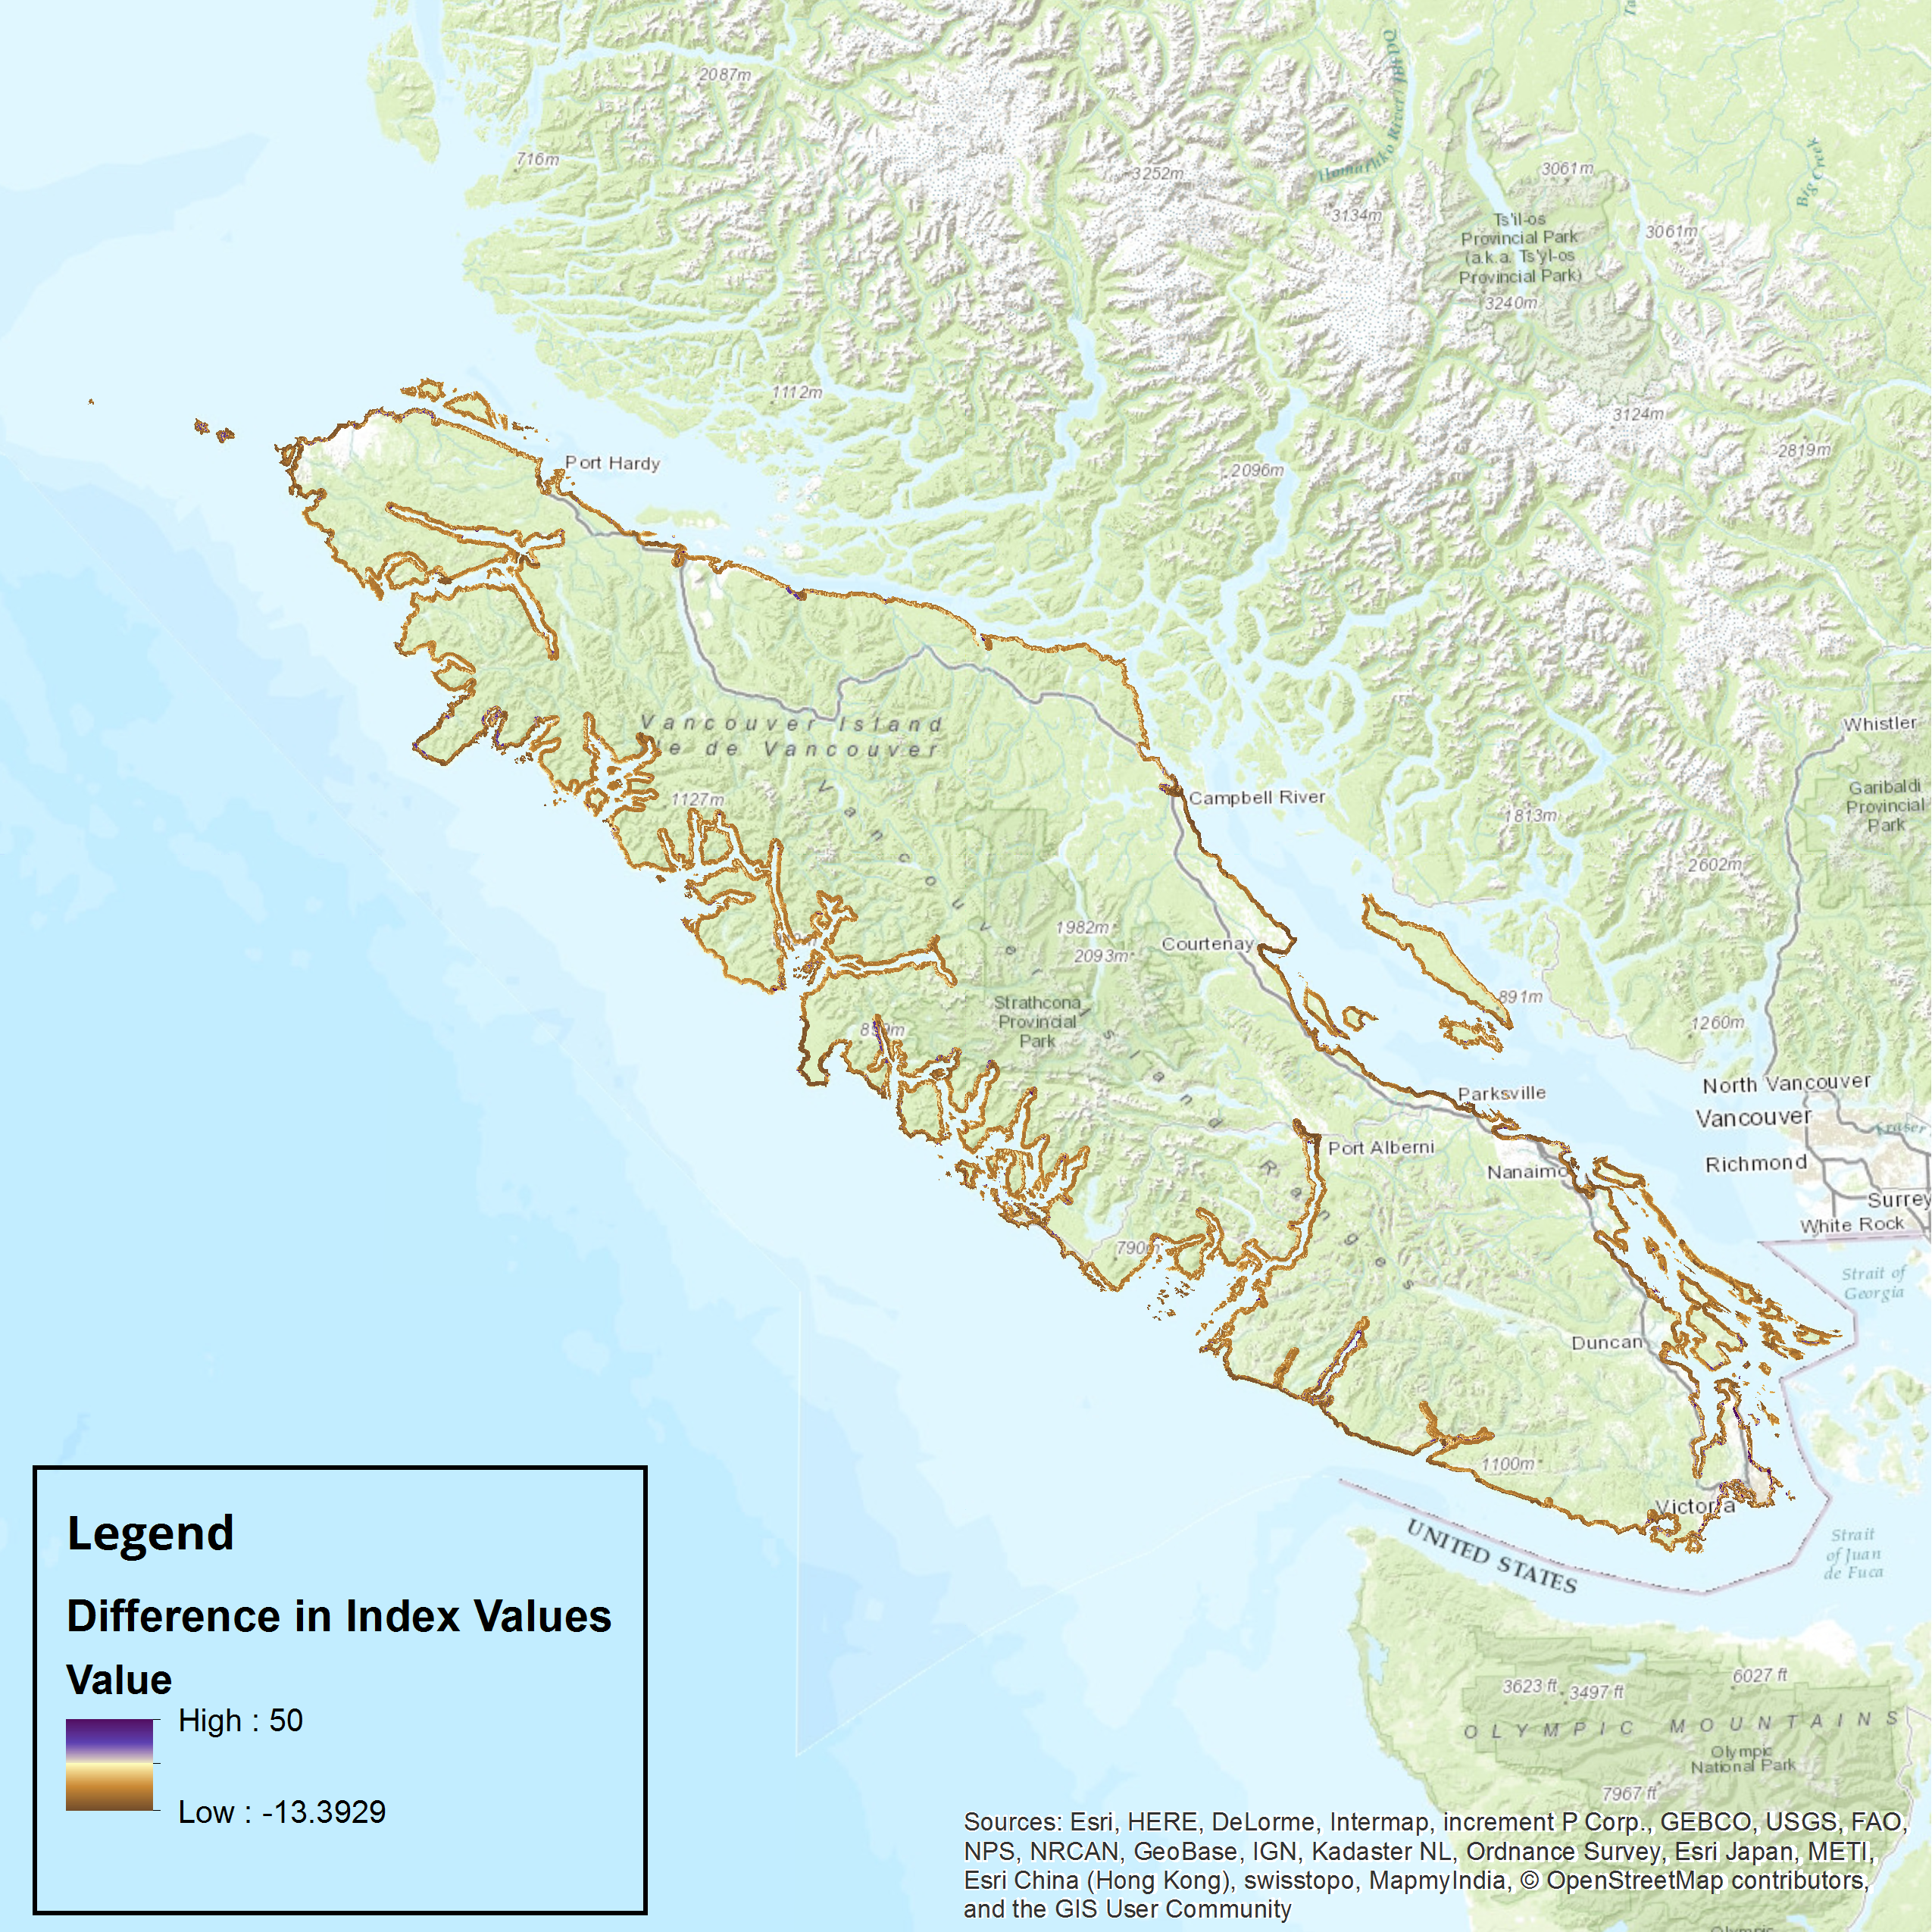
(2) The arithmetic algorithm was used as per the normal model to obtain the physical and socio-economic sub-indexes shown in the results section, but combined together to form a final combined index by ways of a geometric average. This new combined index was also compared to the index obtained through the model adapted from McLaughlin and Cooper (2010) by use of the Minus tool, the results of which are shown below.
Like the sensitivity analysis performed above, the blue regions represent areas where the arithmetic model assigned higher values than the geometric model, while the orange regions represent the opposite. There is a notable skew in the score differences in this analysis, with most of the coast being underestimated by the arithmetic model relative to the geometric algorithm. The exception to these negative values are found in the areas that were evaluated as being the most susceptible to sea level rise by the arithmetic model (Campbell River, Port Alberni etc) as well as some regions 500-1000m inland.
The differences between the two algorithms indicate that the arithmetic model used in this project is highly sensitive to variations in derivation calculations, which may indicate that the results generated from it are not strictly precise or reliable. The general consistency of the index differences when the second calculation step (combination of sub-indexes) is altered indicates that this may be the less sensitive step, and that the method by which the ranked variables are merged into a single sub-index has a more significant bearing on the final result. It may also be possible that the inclusion of more variables for the geometric algorithm would increase this disparity owing to the calculations being dependent on the product rather than the sum of the variables (Gornitz 1990).
It is highly likely that the model employed in this project is oversimplified, which therefore lends it towards being unrepresentative of the risk a coastal region may be under. It might be helpful to use a different algorithm that is more robust and comprehensive (Hennecke 2004, Dasgupta et al. 2009).
However, it should be noted that the restriction of both algorithms to equal-weight functions prevents the dominance of a single variable that may skew the results. It can be argued that this is the most objective way of constructing a model, seeing as how the exercise of assigning weights is often carried out through the use of value judgments (Cendrero and Fischer 1997). It is likely that the model used is less sensitive owing to this facet of its design.
Scale-Dependency and Modifiable Areal Unit Problem (MAUP)
Sensitivity Analysis | Scale-dependency and MAUP | Data Uncertainty | Lack of Data
In the model they developed for Northern Ireland, McLaughlin and Cooper (2010) examined the effects of the varying importance of different variables at different scales. McLaughlin and Cooper argue that many of the variables used in their constructed index lose their applicability with a variation in scale – for example, the bedrock geology would have important implications for the ease of erosion of the coast on a national or regional level, but would have little variation when examining a local beach consisting of a single lithology. Thus, McLaughlin and Cooper chose to switch out variables when constructing three different sensitivity indexes for the national, regional and local scales. This author was unable to do so for Vancouver Island owing to a lack of data on a smaller scale, and therefore chose to perform all analyses at a resolution of 90m, which falls between the national and regional scales defined by McLaughlin and Cooper.
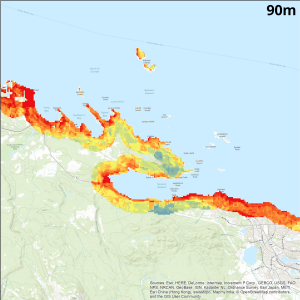
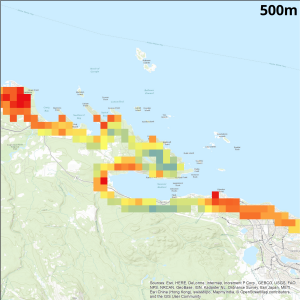
The lack of variations in variable choice between scales and the limiting of analysis to a single resolution lends itself to inaccuracies when looking at the index in finer detail. The MAUP results from the aggregation that occurs with a decrease in scale, generalizing any possible variations in data within the cell into a single value that may not be fully representative (Wong 2004). The restriction of the analyses performed to a 90m resolution precludes the model from drawing conclusions at a scale that is finer than that cell size. This is illustrated by the figures below, wherein the variations of coastal sensitivity of Nanoose Bay on Vancouver Island for the index calculated at a 90m resolution are masked when the index is calculated at a 500m cell size.
The combined effects of these two issues suggests that the model in this project can only be used to describe the coastal sensitivity of Vancouver Island on a regional scale, and would not be applicable to the analysis and evaluation of sensitivity to a local scale like cities or individual beaches and bays.
Data Uncertainty
Sensitivity Analysis | Scale-dependency and MAUP | Data Uncertainty | Lack of Data
An issue with the datasets and calculations used in this project was discerned during the generation of the sub-indexes. Some of the variables employed were logically converted to continuous surfaces of ranking values (elevation, aspect, inland buffer, road density), but the population data used may not have been suitable. The ideal dataset would allow for the generation of a continuous surface that represents the population density of Vancouver Island at a 90m resolution, but the use of dissemination block data for a measure of population would be unrepresentative of any towns or villages that are not large enough to be defined as a dissemination block of its own. This would mean that smaller settlements on the west coast of Vancouver Island may have been ignored during the analyses performed for this project due to their inclusion into a single dissemination block that covers a greater expanse of the coast. A final index that accounts for the variability of population density along a coast that has been grouped into a single grouping for a census may see a greater variation in results than the index map presented in this project.
It should also be noted that while the solid geology, land use and conservation area datasets were assigned ranks based on sharp boundaries, the divisions between two categories within a single dataset may be less defined in reality. The ranking system used in this project does not account for this potential fuzziness of categories and subsequent ranks, which may result greater inaccuracies along the sections of coast that intersect these boundaries.
Lack of Data
Sensitivity Analysis | Scale-dependency and MAUP | Data Uncertainty | Lack of Data
Most models employed in the evaluation of coastal sensitivity use 6 to 19 variables to derive an index of risk (Cooper and McLaughlin 1998). This project uses just 4 owing to a lack of available data and time limitations, which implies that the resultant coastal sensitivity index of Vancouver Island may be oversimplified. The exclusion of a potential important factor (such as coastal forcing – used in McLaughlin and Cooper 2010) could result in the index map being wholly unrepresentative. The lack of available data has also limited this project’s use to different scales (as described in the MAUP section). Further improvements to the model could be made with the inclusion of more variables at different scales, thus making it far more applicable as a whole, and possibly allowing for its future adaptation and use in decision-making for the management of climate change for the coasts of Vancouver Island.