
First raised up in 1950s, machine learning which entails “training” of the computer for predictive tasks can be roughly divided into two types, supervised and unsupervised learning. In this blog, certain examples will be presented to help explain what unsupervised learning is and how it works.
Before we start, here is a short video introducing briefly supervised and unsupervised learning and some of their applications.

Video: “Unsupervised Learning – Georgia Tech – Machine Learning”. Source Youtube
Differing from supervised learning, unsupervised learning generally do not require the input data to be classified in advance. Imagine we have a group of meat, including perhaps beef braised, hamburger, beef roast, and beef steak etc. We don’t know which of them relate more closely with each other but we want to classify them based on our knowledge of their nutrient value (e.g. level of protein, fat, calcium and iron etc.).
|
energy |
protein |
fat |
calcium |
iron |
|
|
Beef Braised |
340 |
20 |
28 |
9 |
2.6 |
|
Hamburger |
245 |
21 |
17 |
9 |
2.7 |
|
Beef Roast |
420 |
15 |
39 |
7 |
2.0 |
|
Beef Steak |
375 |
19 |
32 |
9 |
2.6 |
Data from Nutrient dataset of flexclust package in R.
Under this scenario, the unsupervised learning and more specifically, clustering can be performed. Essentially, a common step shared by all different clustering algorithms is the calculation of distances between entities to be clustered. In the table below, the Euclidean distance between each meat and every others are calculated in terms of their variations in all nutrient values.
|
Beef Braised |
Hamburger |
Beef Roast |
Beef steak |
|
|
Beef Braised |
0.0 |
95.6 |
80.9 |
35.2 |
|
Hamburger |
95.6 |
0.0 |
176.5 |
130.9 |
|
Beef Roast |
80.9 |
176.5 |
0.0 |
45.8 |
|
Beef Steak |
35.2 |
130.9 |
45.8 |
0.0 |
Data from Nutrient dataset of flexclust package in R.
Then each meat will be treated as a cluster and what we have calculated above are equivalently distances between single-element meat clusters. As is shown in the following image, we then attempt to combine all clusters into one starting from the two that are closest. In this case, Beef braised and steak will be first merged, which are then combined with beef roast, and finally with hamburger, contributing to a single cluster.
People may find it naive to classify these four meat types as hamburger will definitely be a lot more different from the other three beef. But when it comes to a set of meats whose inter-relations are more obscure like the set below, unsupervised learning (or classification in this case) can help disclose the underlying information hidden in the data that are otherwise inaccessible relying only on human observations.
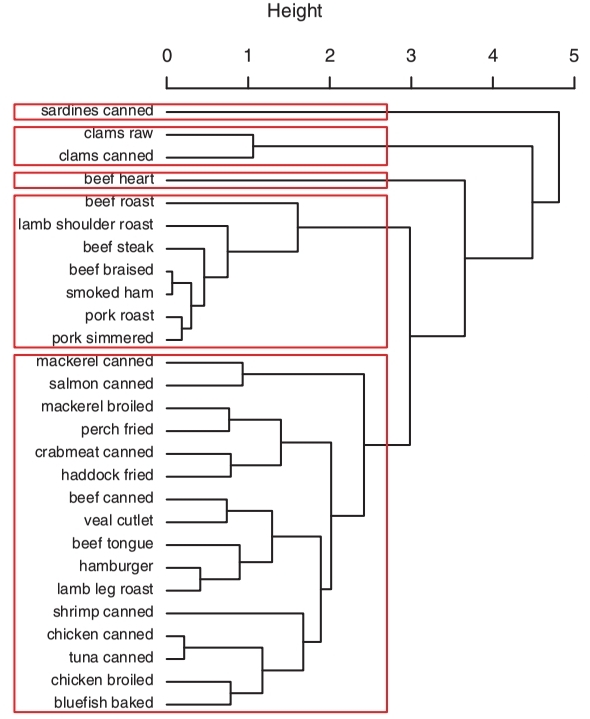
Clustering of meat. Source: R in action. Chapter 16 Cluster analysis
Moreover, not only explicit data entities can be classified, images, as a special type of data, can also be classified using unsupervised learning. The only difference is that Euclidean distances between images are implicitly calculated as differences in pixel values instead of the distances explicitly between for instance, the nutrient values.
From the example below, we can discover that although this brute distance-calculating approach can help discern black from white faces, it cannot really group the face based on the delivered emotions, i.e. the laughing faces cannot be segregated from those with negative emotions.
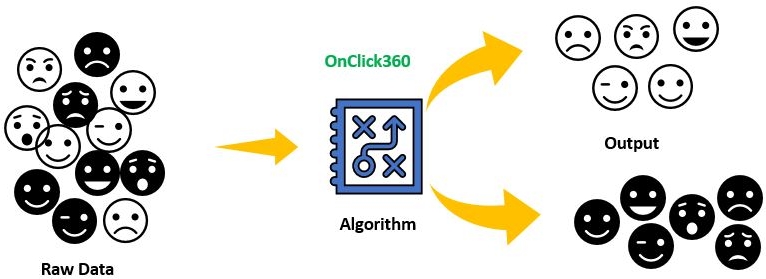
Unsupervised machine learning. Source: onClick360.
Therefore, in order to customize the standard how the given entities are treated by the computer, supervised learning have to be employed. Please follow up with my next post if you are interested.
– (Fred) Zhuoting Xie