Category Archives: Science Communication

Dogs: more than just cute!

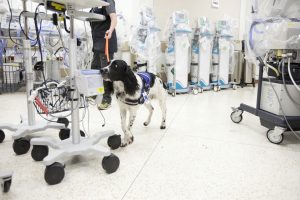
Angus, one of two “super sniffer” dogs trained to alert their handler when they detect C. difficile. Source: Vancouver Coastal Health

We’ve all seen (or heard of) drug-sniffing dogs, but what about bacteria-sniffing ones?

Since 2016, a team from Vancouver Coastal Health has been tweaking a program that trains dogs to alert their handlers when they detect the scent of C. difficile. Over an 18-month period, the two dogs (Angus and Dodger) that have been trained for this role have detected 391 areas at Vancouver General Hospital where this bacteria was found.

Clostridioides difficile, more commonly referred to by its shorthand C. difficile or simply C. diff, are the leading cause of nosocomial (or hospital-originating) infectious diarrhea. Formerly known as Clostridium difficile, the bacterium was renamed late last year to more accurately portray the genus it falls in.

Angus and Dodger were trained with scent training kits from the Scientific Working Group on Dog and Orthogonal detector Guidelines (SWGDOG), which allowed them to identify the distinct odour of C. difficile. Microorganisms smell due to the variety of volatile chemicals they produce in response to various external factors. In the specific case of C. difficile, it is often described as having a sickly sweet or particularly foul smell.

The symptoms of a C. difficile infection can range from mild abdominal cramping to life-threatening sepsis and inflammation of the colon. The full range of symptoms can be found here. Most cases occur after taking antibiotics, which may kill both the good and bad bacteria in your gut – these are known as your gut microbiota. 

Without your normal gut microbiota, C. difficile can take advantage of this “clean slate” and proliferate in your intestine, throwing off the balance of good and bad bacteria. Within a period of several days to a few weeks, infected patients will start to show symptoms – the most common being diarrhea. Ideally, somebody with symptoms of infection will have tests done by a doctor and undergo treatment if necessary.

The progression of infection and the post-infection considerations are shown below in this graphic published by the Centre for Disease Control:
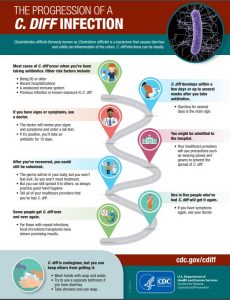
The progression of a C. diff infection. Source: Centre for Disease Control

In a study published by the Canadian Journal of Infection Control, it was found that 82% of contaminated surfaces were found in common areas. These included washrooms, hallways, and waiting rooms. Even with the most stringent sanitization procedures, it was relatively easy to find in areas that are commonly overlooked! 

One of the areas that tested positive for C. difficile contamination was inside a toilet paper dispenser – something that I personally would never think to sanitize. 

While there’s still a lot of work that needs to be done before we can train dogs to safely detect all sorts of infectious bacteria, the developments of the canine scent detection program are notable steps in the right direction. 

For more information about canine scent detection of C. difficile in Vancouver-area hospitals, you can learn more here and through this page.

Link

Machine learning: Unsupervised Learning

First raised up in 1950s, machine learning which entails “training” of the computer for predictive tasks can be roughly divided into two types, supervised and unsupervised learning. In this blog, certain examples will be presented to help explain what unsupervised learning is and how it works.


Before we start, here is a short video introducing briefly supervised and unsupervised learning and some of their applications.

YouTube Preview Image

Video: “Unsupervised Learning – Georgia Tech – Machine Learning”. Source Youtube


Differing from supervised learning, unsupervised learning generally do not require the input data to be classified in advance. Imagine we have a group of meat, including perhaps beef braised, hamburger, beef roast, and beef steak etc. We don’t know which of them relate more closely with each other but we want to classify them based on our knowledge of their nutrient value (e.g. level of protein, fat, calcium and iron etc.).

energy

protein

fat

calcium

iron

Beef Braised

340

20

28

9

2.6

Hamburger

245

21

17

9

2.7

Beef Roast

420

15

39

7

2.0

Beef Steak

375

19

32

9

2.6

Data from Nutrient dataset of flexclust package in R.


Under this scenario, the unsupervised learning and more specifically, clustering can be performed. Essentially, a common step shared by all different clustering algorithms is the calculation of distances between entities to be clustered. In the table below, the Euclidean distance between each meat and every others are calculated in terms of their variations in all nutrient values.

Beef Braised

Hamburger

Beef Roast

Beef steak

Beef Braised

0.0

95.6

80.9

35.2

Hamburger

95.6

0.0

176.5

130.9

Beef Roast

80.9

176.5

0.0

45.8

Beef Steak

35.2

130.9

45.8

0.0

Data from Nutrient dataset of flexclust package in R.


Then each meat will be treated as a cluster and what we have calculated above are equivalently distances between single-element meat clusters. As is shown in the following image, we then attempt to combine all clusters into one starting from the two that are closest. In this case, Beef braised and steak will be first merged, which are then combined with beef roast, and finally with hamburger, contributing to a single cluster.

People may find it naive to classify these four meat types as hamburger will definitely be a lot more different from the other three beef. But when it comes to a set of meats whose inter-relations are more obscure like the set below, unsupervised learning (or classification in this case) can help disclose the underlying information hidden in the data that are otherwise inaccessible relying only on human observations.


Clustering of meat. Source:  R in action. Chapter 16 Cluster analysis


Moreover, not only explicit data entities can be classified, images, as a special type of data, can also be classified using unsupervised learning. The only difference is that Euclidean distances between images are implicitly calculated as differences in pixel values instead of the distances explicitly between for instance, the nutrient values.

From the example below, we can discover that although this brute distance-calculating approach can help discern black from white faces, it cannot really group the face based on the delivered emotions, i.e. the laughing faces cannot be segregated from those with negative emotions.

Unsupervised machine learning.  Source: onClick360


Therefore, in order to customize the standard how the given entities are treated by the computer, supervised learning have to be employed. Please follow up with my next post if you are interested.


– (Fred) Zhuoting Xie