Dogs: more than just cute!

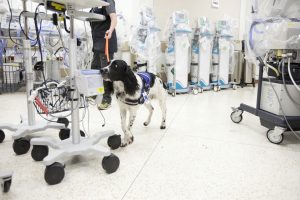
Angus, one of two “super sniffer” dogs trained to alert their handler when they detect C. difficile. Source: Vancouver Coastal Health

We’ve all seen (or heard of) drug-sniffing dogs, but what about bacteria-sniffing ones?

Since 2016, a team from Vancouver Coastal Health has been tweaking a program that trains dogs to alert their handlers when they detect the scent of C. difficile. Over an 18-month period, the two dogs (Angus and Dodger) that have been trained for this role have detected 391 areas at Vancouver General Hospital where this bacteria was found.

Clostridioides difficile, more commonly referred to by its shorthand C. difficile or simply C. diff, are the leading cause of nosocomial (or hospital-originating) infectious diarrhea. Formerly known as Clostridium difficile, the bacterium was renamed late last year to more accurately portray the genus it falls in.

Angus and Dodger were trained with scent training kits from the Scientific Working Group on Dog and Orthogonal detector Guidelines (SWGDOG), which allowed them to identify the distinct odour of C. difficile. Microorganisms smell due to the variety of volatile chemicals they produce in response to various external factors. In the specific case of C. difficile, it is often described as having a sickly sweet or particularly foul smell.

The symptoms of a C. difficile infection can range from mild abdominal cramping to life-threatening sepsis and inflammation of the colon. The full range of symptoms can be found here. Most cases occur after taking antibiotics, which may kill both the good and bad bacteria in your gut – these are known as your gut microbiota. 

Without your normal gut microbiota, C. difficile can take advantage of this “clean slate” and proliferate in your intestine, throwing off the balance of good and bad bacteria. Within a period of several days to a few weeks, infected patients will start to show symptoms – the most common being diarrhea. Ideally, somebody with symptoms of infection will have tests done by a doctor and undergo treatment if necessary.

The progression of infection and the post-infection considerations are shown below in this graphic published by the Centre for Disease Control:

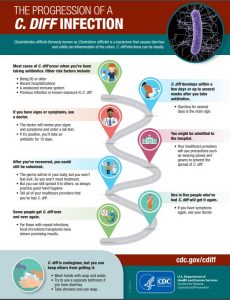
The progression of a C. diff infection. Source: Centre for Disease Control

In a study published by the Canadian Journal of Infection Control, it was found that 82% of contaminated surfaces were found in common areas. These included washrooms, hallways, and waiting rooms. Even with the most stringent sanitization procedures, it was relatively easy to find in areas that are commonly overlooked! 

One of the areas that tested positive for C. difficile contamination was inside a toilet paper dispenser – something that I personally would never think to sanitize. 

While there’s still a lot of work that needs to be done before we can train dogs to safely detect all sorts of infectious bacteria, the developments of the canine scent detection program are notable steps in the right direction. 

For more information about canine scent detection of C. difficile in Vancouver-area hospitals, you can learn more here and through this page.

Link

Machine learning: Unsupervised Learning

First raised up in 1950s, machine learning which entails “training” of the computer for predictive tasks can be roughly divided into two types, supervised and unsupervised learning. In this blog, certain examples will be presented to help explain what unsupervised learning is and how it works.


Before we start, here is a short video introducing briefly supervised and unsupervised learning and some of their applications.

YouTube Preview Image

Video: “Unsupervised Learning – Georgia Tech – Machine Learning”. Source Youtube


Differing from supervised learning, unsupervised learning generally do not require the input data to be classified in advance. Imagine we have a group of meat, including perhaps beef braised, hamburger, beef roast, and beef steak etc. We don’t know which of them relate more closely with each other but we want to classify them based on our knowledge of their nutrient value (e.g. level of protein, fat, calcium and iron etc.).

energy

protein

fat

calcium

iron

Beef Braised

340

20

28

9

2.6

Hamburger

245

21

17

9

2.7

Beef Roast

420

15

39

7

2.0

Beef Steak

375

19

32

9

2.6

Data from Nutrient dataset of flexclust package in R.


Under this scenario, the unsupervised learning and more specifically, clustering can be performed. Essentially, a common step shared by all different clustering algorithms is the calculation of distances between entities to be clustered. In the table below, the Euclidean distance between each meat and every others are calculated in terms of their variations in all nutrient values.

Beef Braised

Hamburger

Beef Roast

Beef steak

Beef Braised

0.0

95.6

80.9

35.2

Hamburger

95.6

0.0

176.5

130.9

Beef Roast

80.9

176.5

0.0

45.8

Beef Steak

35.2

130.9

45.8

0.0

Data from Nutrient dataset of flexclust package in R.


Then each meat will be treated as a cluster and what we have calculated above are equivalently distances between single-element meat clusters. As is shown in the following image, we then attempt to combine all clusters into one starting from the two that are closest. In this case, Beef braised and steak will be first merged, which are then combined with beef roast, and finally with hamburger, contributing to a single cluster.

People may find it naive to classify these four meat types as hamburger will definitely be a lot more different from the other three beef. But when it comes to a set of meats whose inter-relations are more obscure like the set below, unsupervised learning (or classification in this case) can help disclose the underlying information hidden in the data that are otherwise inaccessible relying only on human observations.


Clustering of meat. Source:  R in action. Chapter 16 Cluster analysis


Moreover, not only explicit data entities can be classified, images, as a special type of data, can also be classified using unsupervised learning. The only difference is that Euclidean distances between images are implicitly calculated as differences in pixel values instead of the distances explicitly between for instance, the nutrient values.

From the example below, we can discover that although this brute distance-calculating approach can help discern black from white faces, it cannot really group the face based on the delivered emotions, i.e. the laughing faces cannot be segregated from those with negative emotions.

Unsupervised machine learning.  Source: onClick360


Therefore, in order to customize the standard how the given entities are treated by the computer, supervised learning have to be employed. Please follow up with my next post if you are interested.


– (Fred) Zhuoting Xie

Global Warming Is Pushing Pacific Salmon Population’s to the Brink of Extinction

You may not have noticed it yet but there has been a steady increase in the price of salmon in consumer stores. The reason for this is due to the high demand and low availability of these fish. Pacific salmon are a very important species of fish that contribute to the economy and play a very critical part in the food chain as the primary source of food for many animals including humans and the iconic black and brown bears. Their annual migration provides an insight into the yearly population and the abundance of their species.

However, the pacific salmon population has decreased in the past few decades due to the effects of global warming causing changes within the habitats they live in. This leads to issues such as suboptimal diets that have caused a decrease in salmon health leading to death. Predators have shifted to a higher salmon diet as their other prey are becoming less abundant due to changes in climate. Rising sea levels, destroying important transition zones for juvenile salmon, has also caused the salmon population to decrease even further.

As ocean temperatures rise, warmer ocean currents pull less nutritious plankton from the central oceans and deposit them to the salmon feeding grounds, at the same time driving out the more nutritious plankton from the coastal waters. (McSheffrey 2016). This can be a disaster for the salmon as the prey they consume also feed on this plankton. As the salmon prey cannot survive on such nutrient-limited plankton they start to die off and the remaining salmon are left with no choice but to substitute their regular feeding habits to accommodate a higher less nutritious plankton filled one. In the short term, this can sustain the fish, however, in the long term this plankton diets lead to lower energy production and a less nutritious diet which in turn makes the fish weaker and more likely to die.

While the salmon prey changes, the predators that prey on salmon have been moving to a higher salmon-filled diet. Global warming has not only affected the salmon’s food source but the food source of many predators that prey on salmon. Predators must change their diets as their other prey has been steadily decreasing. They must also resort to eating a higher percentage of a different species and in this case, it is a higher salmon diet. For decades the salmon and predator population has coexisted, “but salmon populations have come under stress from many sides, reducing salmon numbers and causing an unnatural predator-prey balance” (PBS 2016).  Some of the salmon’s main predators include gulls, sharks, pollack, cod, seals, pike otters, and killer whales. The result of these predators consuming a higher number of salmon causes an overall decrease in the number of salmon. Global warming plays a critical role in the predator to prey ratio and has a very drastic role in the depreciation of salmon.

If suboptimal diets and increased predation was not enough for the salmon to deal with adding habitat loss to the list of challenges is sure to cause a drastic decrease in the salmon population. Most salmon lay their eggs in estuaries that provide an important transition zone from a freshwater habitat to live in saltwater. (National Ocean And Atmospheric 2012). These areas are critical for salmon as it allows juvenile salmon to feed and provide them with a refuge area from predators, allowing for a higher percentage of juvenile salmon to make it to adulthood. As global warming causes ocean levels to rise, the water from the ocean sometimes floods into these low-lying estuaries altering the ecosystem in a way that cannot be reversed (National Wildlife Federation 2009) With these important transition zones being permanently altered, the juvenile salmon are now unable to obtain the proper food and protection from predators, thus, decreasing the probability of the salmon making it to adulthood.

Salmon species are very sensitive to any change in their environment and this can play a drastic role in their population.  These animals are an essential part of the world and their oceanic environment. Global warming is the main reason the salmon population is declining, sustaining the salmon population is critical if one wants to ensure the survival of this species.

Image by BBC’s wildlife photographer Jon Cornforth

Welcome to SCIE 300 Blogging!

Welcome to the SCIE 300 course blog!

Here are few things to note before you start posting. First of all, you should read the blogging resources page under the Create menu. This will help a lot if you’re new to using WordPress; you’ll find video tutorials about writing posts on this blog, adding media to your posts, tagging, and categorizing. You’ll also find a link to the grading rubric for your blog posts.

Next, check out the blogging guidelines. Here you’ll find the answer to the question: “What are we supposed to blog about?” You can also check out one of last term’s blogs for some additional inspiration.

There are a few important things to keep in mind when blogging. Please do not assume that just because something is online, it is OK for you to use it. For example, unless it is explicitly stated, an image on the internet can not just be copied, saved, and used in your own post without permission to do so. We’ve provided you with a lot more detail about properly using online content, but if you have questions, let us know.

This blog also contains a lot of resources for you. For example, also under the Create menu, there is a list of suggested software to use for your projects. We’ve also collected some writing and presentation resources. Basic audio/visual equipment can be borrowed from SCIE300. Contact the course coordinator for more info.

Under the Explore menu, you’ll find some sample podcasts and videos, links that may be of interest or assistance, a list of groups and associations related to communicating science, as well as a list of local museums and science centres. The Explore menu also contains a library resources page, which you should definitely have a look at. Finally, there is a bookshelf that lists relevant books that are on reserve for you in Woodward Library.

Let us know if you have any questions about the blog or would like to see any other resources made available. Or, if you find something that you think would be useful to the rest of the class, tell us, and we can add it to the resources. Better yet — write a post about it!

Happy blogging!

The Science 300 Team