By: Natalie Muk, Nick Chung, Ryan Liggayu
Link to the website: https://serialkillertrends.weebly.com/
Objectives
Our term project explores the relationships between childhood trauma and serial killers. Serial killing has been and is currently a trending topic in popular culture due to the public’s fascination with the twisted nature of these murderers. With the advent of Netflix series and movies that have aimed to educate and entertain in the genre of true crime, such as ‘Dahamer,’ it begs the question- Were serial killers born this way? Or were they somehow nurtured to become who they are now? If it is the latter, and in conjunction with a world that is increasingly distressed, then rigorously exploring the childhood and upbringing of serial killers in the past becomes a pressing field of study for the present.
This project attempts to visualize and find intersections between the different facets of childhood trauma/abuse, inflictors of trauma, planning of killings, gender of victims, and motives of serial killers in adulthood. To that regard, we aim to reach audiences that seek educational insight surrounding those topics, including counsellors, psychiatrists, victims of childhood trauma, and potentially even the casual viewer. However, our objective is not only to reach these audiences, but to do so with utmost caution, sensitivity, and empathy. We recognize the gravity of serial killers and their actions and how this topic may affect others. Our group acknowledges that although pop culture may capitalize on these subjects, ethics maintain that the purpose behind studying serial killers should primarily be to inform and improve the conditions of those affected, or to increase awareness on behavioural patterns that may require medical help. To that effect, we hope our information can be used productively (and not just entertainment) and advances knowledge on serial homicide.
Our project mainly worked with a high-level perspective that included our audience consuming and analyzing the information presented. To consume information, Munzner breaks down three audience objectives: Discover, Present and Enjoy—to which our visualizations accomplish all three (2015). Our interactive visualizations and infographics mainly serve to present data to our audience; however, there are also opportunities, especially in our interactive visualizations, to discover insights to the data. Outside of consumption, viewers are also able to analyze our data by deriving patterns that we missed. Specifically, and in contrast to our project that analyzes the most common characteristics in a serial killer, a viewer may instead look to find the characteristics least found in a serial killer- the rare characteristics. Finally, mid-level actions like browsing, and subsequently the low-level actions to identify and to compare what was browsed, are all supported by our interactive visualization.
Data
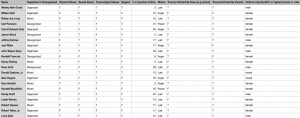
Our data was harvested from an academic, peer reviewed article from the Journal of Police and Criminal Psychology which analyzed the childhood trauma of 73 serial killers (Aamodt and Mitchell 2005). Of them, more than 90% reported at least one type of childhood abuse. 50 of these killers were put into a dataset that detailed the type of childhood abuse they experienced and if their attacks were planned, categorized as: organized, disorganized, and mixed. Maintaining consideration for the sensitivity of the issue, we decided more information about the correlation between serial killers and childhood abuse was needed. For a more in-depth analysis, the dataset was cleaned to 21 rows, which included a mix of killers with victims ranging from 1 – 70 and a range of all 3 organization types. The small sample size ensures viewers can scrutinize each killer without merely developing a generalization. From there, we researched each killer and created columns for the identified gender of their victims, motive for killing, and who their trauma was inflicted by.
We recognize, however, that despite the study being for academic purposes and the clear disclaimers, there is still bias in the portrayal of the serial killers. It should also be noted that the dataset is centered around male serial killers, but the potential inaccuracies with the information (as they are not primary sources) are the biggest risk in the accuracy of our visualizations. In addition, the small sample size may limit the quality of our insight as typically accuracy improves with larger sample sizes. As a result, we had to include examples of serial killers in our data set that exhibited those traits and supported our conclusion rather forcing a generalization of all killers.

Further, our original dataset had types of abuse organized with “yes” or “no,” but since we noticed that these would be boolean values, we cleaned the data to be represented as T or F instead. This allowed us better input the cleaned dataset into Tableau.
Tools
Tableau Desktop was the perfect tool to create our interactive visualizations because it allows the viewer to filter categories and isolate individuals, simplifying the complex data and prompting a deeper examination through its interactive functions which highlight relevant metadata for each killer. Further, the ability to put two sheets together, facilitates the ease of comparing quantitative and qualitative data. Our knowledge in piecing together a quality visualization through Tableau Desktop is also fairly high, given that we had previous experience in class, so ultimately it was the best choice. However, it is not the most effective tool for demonstrating how the data relates to the overall narrative we are conveying.
Therefore, we used Infogram to create more aesthetic infographics that best depicted the data in a way that better displayed our narrative. The user-friendly interface, extensive features, and our group’s previous experience creating Youtube thumbnails with it aided our ability to produce high-quality, complex designs. Infogram also has animation features that help us effectively direct attention to information on the graphic that we want to emphasize, while maintaining its visual, aesthetic elements. The primary disadvantage to the tool is the limited number of pictures and graphics that are available for use through the free plan, and the change in formatting of the graphics between mobile and desktop views.
Weebly was used for the website as it was extremely user friendly and best facilitated our needs for a simple, one-scroll display.
Analysis
After watching the Netflix series Monster: The Jeffrey Dahmer Story, we gained inspiration to dive deeper into analyzing and identifying patterns between childhood abuse that may or may not lead to the actions of serial killers in the United States.
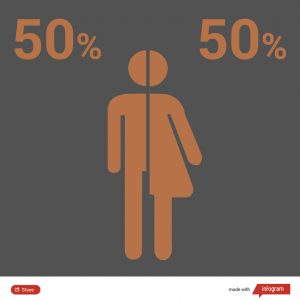
In our early stages of brainstorming, we had discussed about laying the foundation for types of childhood abuse into four categories (physical, psychological, sexual, and neglect), and motives for killing into three categories (anger, lust, and power) to see if there were correlations between these attributes. We realized that a child’s abusive experiences tended to come from two main sources: parents and peers; thus we added two more pieces of metadata to consider in our analysis. As we progressed in our design process, we noticed the staggering number of lust-driven motives while playing around with the visualization on Tableau, prompting us to add ‘gender of majority of victims.’
Because our dataset dealt with so many different attributes, it was a challenge at first to decide on what sort of narrative we wanted to pursue in our visualization. We had sketched out several different ways our design could look like, but after much deliberate consideration, we honed in on creating four separate graphics to illustrate the narrative as we wanted a clear takeaway from our infographics that was specific enough to be memorable. To drive an effective narrative, we knew we had to start broad and have each connection/intersection add new information to our ‘overall insight.’ Therefore, we used what we like to call a “narrative funnel” to tie each element together and ease our design process.
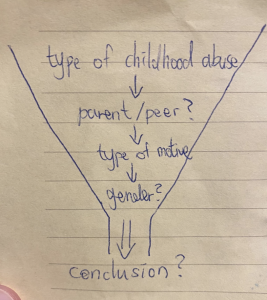
Upon designing the draft infographics and visualizations, we noticed certain patterns in both the data and how we presented the designs that prompted us to shift our narrative. For example, we originally thought that gender played a larger role in the motive for murders, but we eventually noticed that it played no role at all. As a result, our conclusion emphasized more heavily on the inflictor of the abuse, rather than the victims’ profiles. This back and forth of designing and realizing patterns allowed us to best communicate our findings in a comprehensive manner.
Design Approach
After a few general sketches and notes were drafted we immediately knew that a bar chart best demonstrated the number of reported victims for each killer because, as per expressiveness, position on a common scale most clearly illustrated quantitative data (Munzner 2009). The different heights of the bars made identifying and comparing the number of victims extremely easy. We also knew that we wanted two views for our interactive visualization on Tableau because of the sheer amount of qualitative data we had. So a second visualization was conjoined in order to allow viewers to have a full overview of the specific metadata pertaining to each killer, as well as facilitate comparisons between the killers. For all our visualizations, we used colour hues to encode our qualitative data as it was the most effective identity channel to separate the attributes (Munzner 2009). For example, we used three different hues to illustrate the types of motives throughout our website, like red for psychological abuse. Though, as noted by Professor Arias, we wanted to ensure that our visualizations maintained respect for the sensitive topic/information, so we had to rethink our colour palette after first encoding it because it was seemingly too happy and bright.

We thus used more subdued colours to reflect the solemn nature of the topic (Schwabish and Feng 2021). Our deliberate choice to use these colours to represent each motive comes as such: In English culture, purple is a colour often associated with royalty, wealth, and power. Yellow is a colour which often invokes strong feelings and can be associated with actions of deceit, hence, why we used it to represent lust. As for anger, it was clear to us that we were unable to use the commonly represented red, as it would have overlapped in connection to ‘psychological abuse’ in our website and caused confusion. Thus, we chose to go with blue as it is a colour heavily tied to the emotion of sadness, which arise in situations where we feel threatened, frustrated, or powerless, commonly translating to anger.

In accordance with effectiveness, we ensured the most important attributes of our infographic and visualizations were encoded with the salience of the channel. For example, when we depicted the percent of killers who experienced each type of abuse, we used position on a common scale to encode the quantitative data as it was the most important consideration in our dataset.
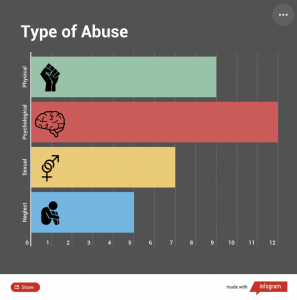
Icons were similarly used to make the identifying of types of abuse easier, and the overall consistency of our colour palette and careful attention to the spacing of our text ensured the principle of beauty in our website as a whole (Lankow et al. 2012). We included a variety of visualization styles, like word cloud and bar charts to best mix qualitative and quantitative data for soundness (Lankow et al. 2012).
To make our visualization more appealing, we encoded motion into it. Referencing concepts from Colin Ware’s book Visual Thinking, he notes that humans are naturally programmed to be attracted to movement from prehistoric hunter and gatherer societies, thus motion in our graphics can aid the viewers to focus on important areas of our graphic (25). For instance, our graphic/word cloud about motive is animated for ‘lust’ to pop up first. Guiding emphasis is to ‘lust’ as the words continue to reveal, further highlighted by the colour and spacing.
For our website, we chose to keep the design fairly simple and straightforward, as we wanted to avoid unnecessary decorations that distracted from our key points (Esteban 2015). An emphasis was put into designing the website with empathy and sensitivity while maintaining the gravity of the topic being discussed. To do this, we first added a content warning after the title to ensure that our audience understands that the information being discussed is sensitive. The colour palette of our website was kept minimal and dark, to once again mirror the gravity of our topic. In accordance with Schwabish and Feng’s recommendation, an equity lens was applied regarding our wording (2021). As much as possible, people-first language was used, and morbid language was kept to a minimum. Discussing serial killers is a complex issue, and the language used aimed to recognize (not discredit) both the horrors of their actions as adults, as well as their tragic and traumatic childhood experiences. Finally, our infograms and visualizations were reviewed to ensure an equity lens was applied. One example of this is in our gender infogram, where orange (rather than a mix of red or blue) was used to avoid perpetuation of any gender stereotype and maintain neutrality.
Our website design includes definitions of terms and concepts, as well as questions to engage the reader’s interest and thinking, remembering the principle of utility to make an objective-based visualization (Lankow et al. 2012). This addition was intentional and served to support our narrative form of communication, in order to optimize presentation flow and information retention by our audiences (Lankow et al. 2012).
Story
After our content warning, our project begins with setting up the viewer’s understanding of what a serial killer is. With context, we then jump into the exploratory question of nature versus nurture and its application to a serial killer’s upbringing. Since the most common abuse experienced was psychological, we filtered our analysis to only serial killers in that category so that we could have a deeper dive into the intersections between the attributes in our data. After a short description of what exactly psychological abuse entails, we move onto our next parameter of analysis- the perpetrator of childhood psychological abuse. Interestingly enough, all serial killers had parent-induced psychological trauma. Our story takes note of this pattern and uses a probing question to transition to the next parameter of analysis- motives of murder. Again, we demonstrate our findings in this parameter through confluent infographics, text, and captivating visuals. Finally, we end our story with an in-depth inspection of serial killers that fit into these specific attributes. By doing this, we connect the numbers to real people, almost like a “case study.” Our conclusion sums up patterns noticed, but also acknowledges that there is still room for exploration in our dataset. We finally encourage viewers to further explore via Tableau and provide resources for mental health.
Pros and Cons of a Website
The use of a website to convey our narrative was very useful, albeit challenging. The website allowed the freedom to combine texts and visuals in a variety of ways. But, Weebly’s website building interface proved to be slow and inaccurate at times, with limited customizability. With time, however, we came up with creative ways to overcome these limitations and work with what we had.
Pros of the website were that it was useful in accommodating our text-heavy visuals where graphics needed to have more detailed information to ensure sensitivity. The website format with scrolling allowed us to design our visuals and text keeping in mind spatial distancing, in a way that was linear and simple to read. The ability to embed Tableau, Infograms, and images also allowed viewers to interact with the visuals immediately and directly.
Some cons of the website include the poor formatting once transferred to a mobile version of our site as the visualizations become morphed and the structure becomes skewed. Further, there may be less engagement with our data as the material is so linear, it is mostly reading from start to finish, instead of interacting.
References
Andone, D. (2019, May 24). A convicted serial killer and rapist was executed as 2 women who survived his attacks watched. CNN. https://edition.cnn.com/2019/05/24/us/bobby-joe-longexecution-florida
Behance. (n.d.). The science behind serial killers infographic. Behance. Retrieved October 20, 2022, from https://www.behance.net/gallery/124193809/The-Science-Behind-Serial-KillersInfographic
Blanco, J. I. (n.d.-a). Glen Edward Rogers | Murderpedia, the encyclopedia of murderers. https://murderpedia.org/male.R/r/rogers-glen.htm
Blanco, J. I. (n.d.-b). James Edward Wood | Murderpedia, the encyclopedia of murderers. https://murderpedia.org/male.W/w/wood-james-edward.htm
Blanco, J. I. (n.d.-c). Joel Rifkin | Murderpedia, the encyclopedia of murderers. https://murderpedia.org/male.R/r/rifkin-joel.htm
Blanco, J. I. (n.d.-d). Lesley Eugene Warren | Murderpedia, the encyclopedia of murderers. https://murderpedia.org/male.W/w/warren-lesley-eugene.htm
Blanco, J. I. (n.d.-e). Randall Woodfield | Murderpedia, the encyclopedia of murderers. https://murderpedia.org/male.W/w/woodfield-randall.htm
Blanco, J. I. (n.d.-f). Randy Kraft | Murderpedia, the encyclopedia of murderers. https://murderpedia.org/male.K/k/kraft-randy.htm
Blanco, J. I. (n.d.-g). William Lester Suff | Murderpedia, the encyclopedia of murderers. https://murderpedia.org/male.S/s/suff-william.htm
Crockett, Z. (2016, December 2). What data on 3,000 murderers and 10,000 victims tells us about serial killers. Vox. Retrieved October 20, 2022, from https://www.vox.com/2016/12/2/13803158/serial-killers-victims-data
Gary Heidnik’s House of Horrors, 30 years later. (2019, July 7). 6abc Philadelphia. https://6abc.com/philadelphia-crime-mass-murder-serial-killer/3429565/
Hunter, B. (2021, September 11). CRIME HUNTER: Serial killer Pee Wee Gaskins a half-pint horror. Torontosun. https://torontosun.com/news/world/crime-hunter-serial-killer-pee-wee-gaskins-was-a-half-pint-horror
Hunter, B. (2022, August 6). CRIME HUNTER: Larry Eyler trolled Midwest for murder victims. Torontosun. https://torontosun.com/news/world/crime-hunter-larry-eyler-trolled-midwest-for-murder-victims
Jenkins, J. P. (2006, November 2). John Wayne Gacy | Biography, Murders, Execution, & Facts. Encyclopedia Britannica. https://www.britannica.com/biography/John-Wayne-Gacy
Jenkins, J. P. (2022, November 24). Jeffrey Dahmer | Biography, Crimes, Death, & Facts. Encyclopedia Britannica. https://www.britannica.com/biography/Jeffrey-Dahmer
Macleans.ca. (2017, January 26). How a reporter’s painful past led to her obsession with a serial killer. https://www.macleans.ca/culture/books/how-a-reporters-painful-past-led-to-her-obsession-with-a-serial-killer/
Marono, A. J., Reid, S., Yaksic, E., & Keatley, D. A. (2020). A Behaviour Sequence Analysis of Serial Killers’ Lives: From Childhood Abuse to Methods of Murder. Psychiatry, psychology, and law : an interdisciplinary journal of the Australian and New Zealand Association of Psychiatry, Psychology and Law, 27(1), 126–137. https://doi.org/10.1080/13218719.2019.1695517
Mitchell, H., & Aamodt, M. G. (2005). The incidence of child abuse in serial killers. Journal of Police and Criminal Psychology, 20(1), 40–47. https://doi.org/10.1007/bf02806705
Munzner, T., Taylor & Francis eBooks A-Z, & O’Reilly for Higher Education. (2015;2014;). Visualization analysis and design. CRC Press, Taylor & Francis Group, CRC Press is an imprint of the Taylor & Francis Group, an informa business. https://doi.org/10.1201/b17511
Nolasco, S. (2020, September 2). “Butcher Baker” prosecutor says Robert Hansen was “a small guy” who quickly transformed into “a monster”: doc. Fox News. https://www.foxnews.com/entertainment/butcher-baker-robert-hansen-documentary
Penned by an American Psychopath | SDSU Library. (n.d.). https://library.sdsu.edu/scua/new-notable/panzram
Schwabish, J., & Feng, A. (2021, June 9). Do no harm guide: Applying equity awareness in data visualization. Urban Institute. https://www.urban.org/research/publication/do-no-harm-guide-applying-equity-awareness-data-visualization
White, M. U. G. T. (2022, January 14). “Scream” documentary details the real serial killer who inspired the original movie. Shreveport Times. https://eu.usatoday.com/story/entertainment/movies/2022/01/13/scream-movie-documentary-danny-rolling-serial-killer-gainesville-ripper-hometown-shreveport/6520568001/
Wiley, J. K. (2006, January 7). Wash. Serial Killer Pleads Guilty. ABC News. https://abcnews.go.com/US/story?id=95301
Hi all, I just want to start by saying that your project was very interesting! I really enjoyed the one-scroll website that you made, as it breaks down the project nicely. I also agree with the way you designed it with empathy and sensitivity in mind by including a content warning after the title. And your choice to make each section a different color, such as yellow for possible motives and orange for victims’ gender, was effective and clever. Here are some of my suggestions to make it *even more awesome*. First, you might want to put an in-text citation for the content on the 6th page, which talked about a study done by the Journal of Police and Criminal Psychology. This would help the audience know where to look for the study that your project is drawing on. Second, in regard to your question about “Are they nurtured to become the way they are”, I had the impression that this statement was a bit too bold since it implied that nurturing was the one and only reason. When, in fact, other factors might be at play like psychological illnesses. So maybe you might want to paraphrase it so that it’d suggest that one’s upbringing might be an important factor, but not necessarily the only cause. Finally, I was thinking that it would be nice if you would elaborate more on the limitations of the study, such as small sample size, that you extracted the data from, and how that might affect your conclusion (i.e generalizability). This would help the audience have a more holistic understanding of your conclusion. Again, kudos to all of you for making this rather gloomy topic interesting!
Thanks for the insights!
Thank you so much for your thorough feedback, it is greatly appreciated! 🙂
Hi Natalie, Nick and Ryan,
I think the dashboard of your InfoVis where you combined the bar graphs with the table is very informative, because one can tell straightaway what information is being presented without having to analyze too much. I really liked how you documented your process of initially choosing primary (red and yellow) and secondary (green) colours as a palette for your interactive dashboard to illustrate the types of motives to choosing subdued colour hues, which really reflects the careful thought and effort put into this project! I also feel that the icons used to on your Weebly website are quite thoughtful and appropriate for this topic as well, as they are simple enough and don’t necessarily illicit any negative or traumatic responses for its users. Since this is a sensitive topic, I think you all did a really good job on putting a content warning for prospective users, which is really considerate for the users and the dark colours of the website really set the tone and mood that this is a serious and grave matter being discussed.
My only feedback would be to also explain why you specifically chose those subdued hues of dark purple, periwinkle and pale yellow or explain what those colour choices represent in the interactive dashboard illustrating the “Number of Reported Victims” to better justify your design choices, since you stated your reasoning for changing your design choices of choosing the red, green and yellow colour hues of the dashboard previously.
Thank you for your thoughtful and considerate insights! 🙂