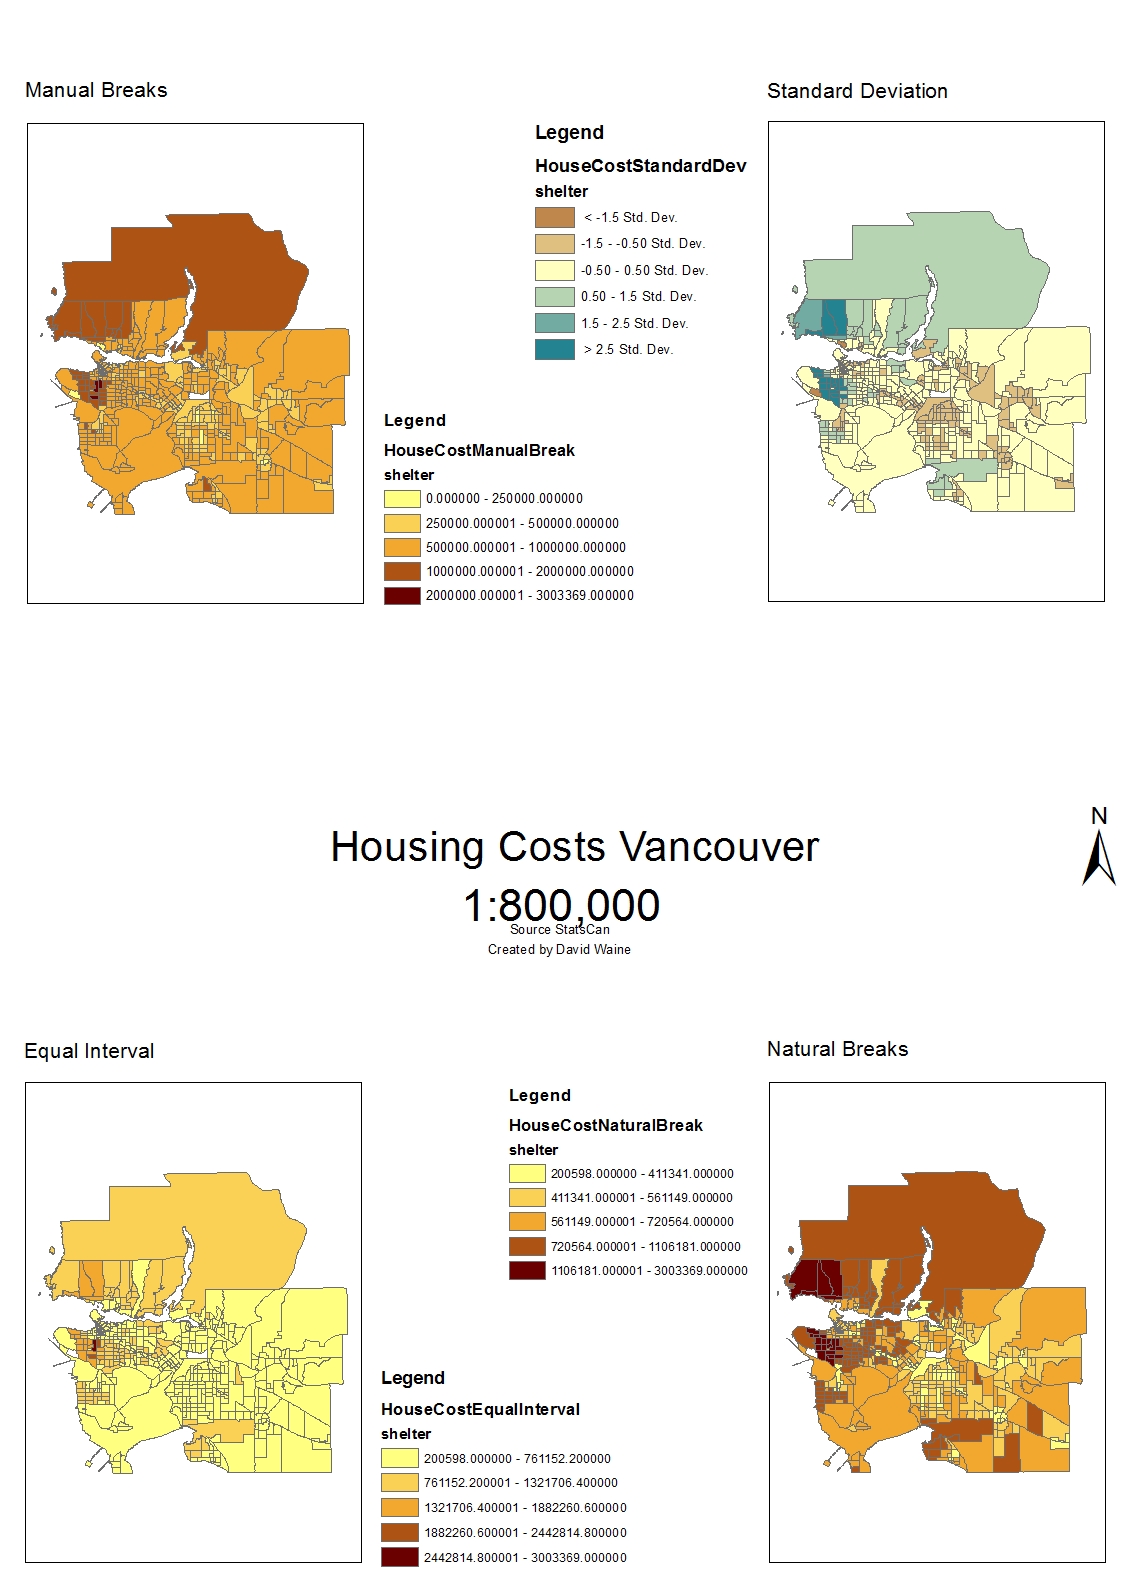
Q8. Different classification methods portray the same data differently as shown by the above maps. All these maps were made using the exact same data but using different classification methods. As a real estate agent I would use natural breaks because it clusters similarly priced areas in to classes. So all areas of similar housing costs are colored similar giving clients a good idea of housing costs at a glance. As a journalist I would use standard deviation because it clearly shows how far off the mean housing costs differ across Vancouver or Montreal. There are ethical implications yes, because by using different classification methods you can present the data in a manner which benefits the goals you are trying to achieve. Whatever that goal may be.
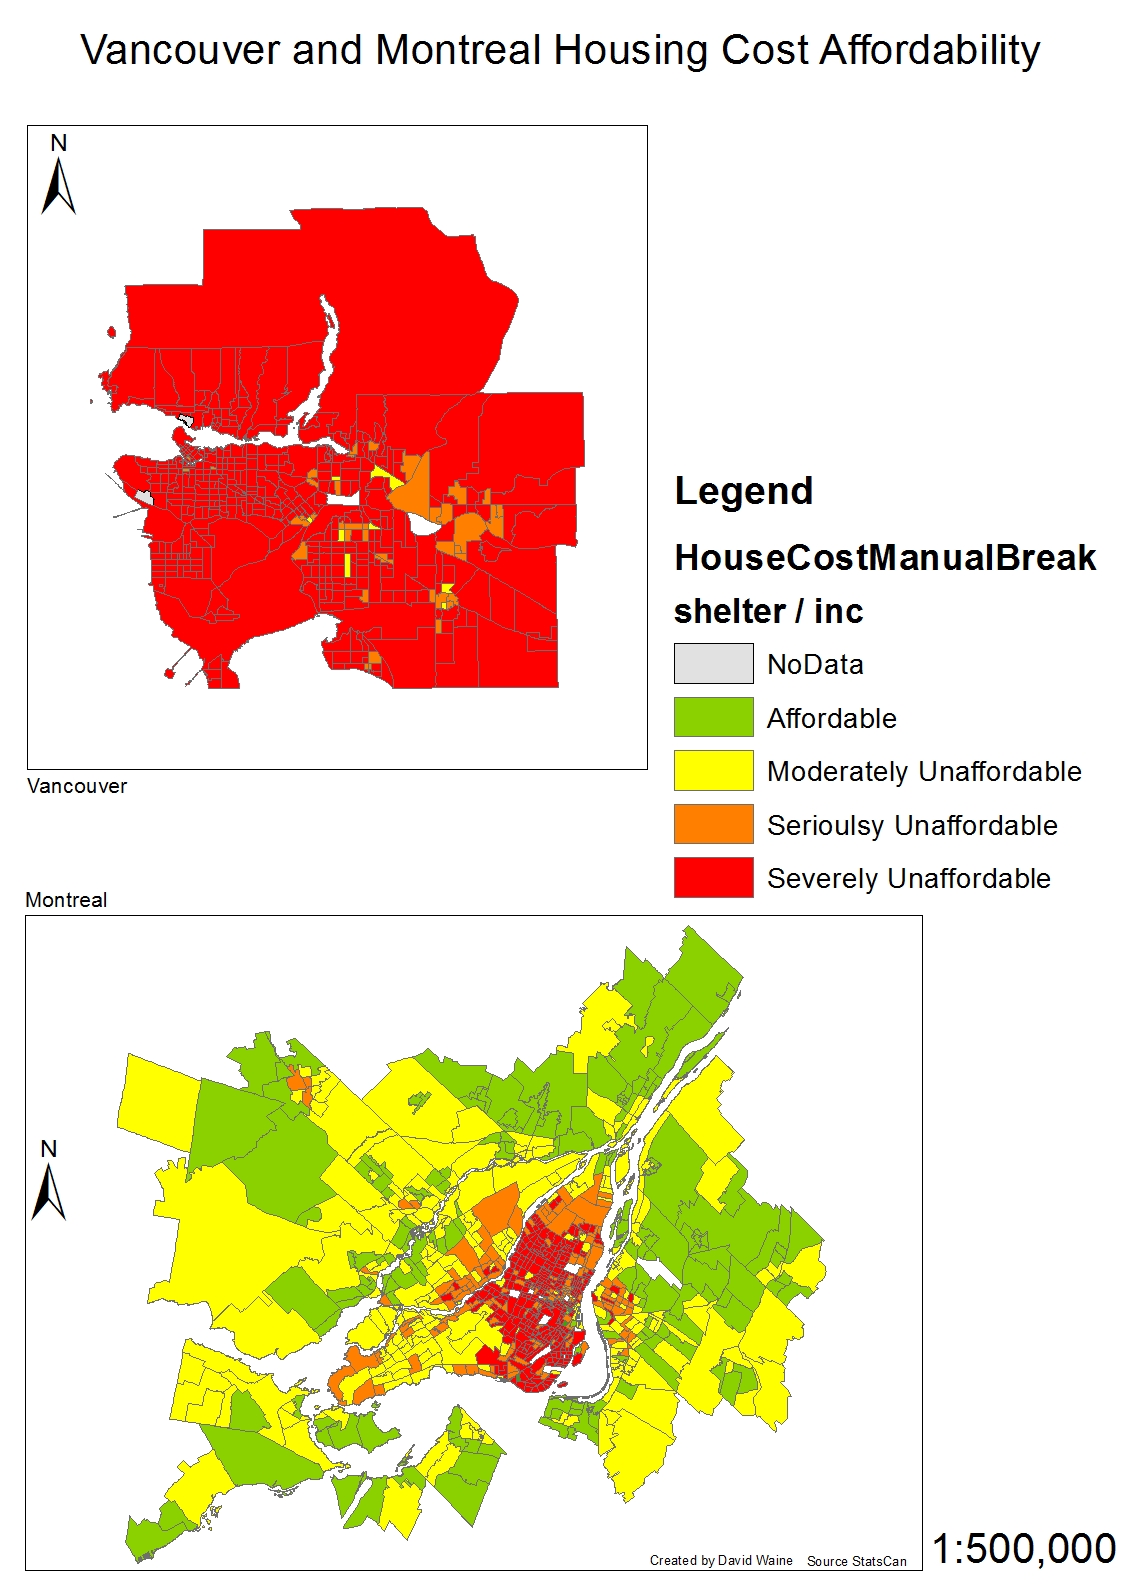
Affordability in this case describes the cost of a dwelling unit (median) normalized to the median income. So it shows how much income per census tract versus how much each dwelling unit costs. This is a better measure of affordability than housing cost alone because it shows how much income can be spent on housing per census tract.
The housing affordability categories are Severely Unaffordable, Seriously Unaffordable, Moderately Unaffordable, and Affordable. These classifications were produced by The NYU Urban Expansion Program which is a think tank and urban action center of the Stern School of Business at the New York University. I would call this group trustworthy because they are an academic group whose goals are to aid municipalities and urban areas in planning for their future urban expansion. I would say that affordability is a useful tool in determining livability but not the only one by far. It plays a role but other factors such as safety, healthcare, education, proximity to work and leisure etc play larger roles I would argue in determining livability of a location.