GEOB 270

GEOB 270 Final Project Evaluation

This final project was to develop a GIS analysis of the Agricultural Land Reserve in British Columbia. Our group was assigned the Central Kootenay sub-panel. We were tasked to evaluate the land content of the ALR to determine using geographical information systems what the actual content/quality of the ALR land is.

I believe my biggest contribution to the project was the sourcing and extraction of the necessary data to complete the project. I also did much of the analysis of the data to help complete the project. I would like to thank Kate Baranova for her excellent contribution to the project. Kate completed much of the analysis and put a large amount of work into developing the individual maps for the project. Without her help I believe the project would not have been completed at the same level of quality (visual and data quality) that it was.

We organized our group at the beginning based on the questions to be answered in the report. Who would source what data for what question and complete the analysis etc. However as the project continued we realized that much of the data was clumped together. So I began to extract the data and then other group members contributed to the analysis. We all worked on the final write up together to complete it on time.

I learned quite a bit about the ALR during this process. The biggest thing I noticed was how low the amount of land in the ALR that was actually productive to agriculture. Also how low the amount of land actually used for agriculture directly is. I think the greatest trick I learned was how to manage my layers and data withing ARC MAP. The naming of layers to better understand what processes had been completed etc. There was much data available publicly however several useful data sets were restricted in access. These data sets if publicly available would have been of benefit to our analysis.
GEOB 270 Professional Development

During the last few months of Geob 270 I have learned many things in regards to Geographical Information Science. I believe the best of what I have learned is how to operate ARC GIS. This geographic information system is of great use to me as a geographer. Being able to navigate and harness this tool will benefit me in future studies and in my future career. I feel that my understanding of GIS has improved greatly and I am now able to share my knowledge much more eloquently.

Lab 5 GEOB 270

Lab5

Report Memorandum

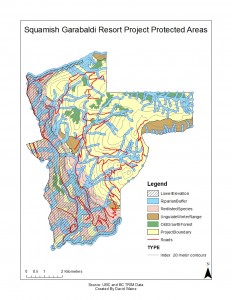
The proposed project is the construction of a ski resort in the Garabaldi Squamish region of British Columbia Canada. The proposed area is demarcated in the finished map (ProjectBoundary). My involvement in the project was to take the data available in regards to protected areas in the project area and show how much of the project area falls under protected status. Be it old growth forest, riparian buffers, ungulate winter ranges or red-listed species habitat.

During the analysis the data was collected from provincial databases which showed the areas protected for the entire province.

-Data was checked for map projections and all data was projected in the same manner.
-All data was clipped to the project area (so only areas within the project area shown)

-Elevation was divided between upper and lower elevations (below 555m)
-Streams and rivers were buffered by provincial standards for riparian areas. 50m for upper elevations and 100m for lower elevations.
-Red listed plant species habitats were selected and shown on the map.
-All protected areas were combined to show total protected area.
-All lower elevations were displayed using a crosshatched overlay on the map.
-Total areas for each protected area were calculated as a percent of total project area, both individually and combined.

In general I found 6.79% of area is protected old growth forest, 7.89% ungulate winter range, 24.8% red-listed species, and 30.13% riparian buffers. In total 55.4% of the project area is protected. Of the total project area 30.13% is below 555m in elevation.

In my opinion the two greatest environmental concerns are the riparian buffer zones and the red-listed species habitat. To mitigate impacts to these areas I would suggest building the resort on the upper elevations where red-listed species are not as prevalent and the riparian zones are fewer. Also using pre-existing road networks as much as possible during construction of the resort and during its operation could help mitigate the impacts as well.

I personally feel that this project should not go ahead with construction. I believe that since protected areas make up more than fifty percent of the project area any construction would have too large of an environmental impact.  In the memo I wrote did not recommend that the project should go ahead or not. I only wrote what could be done to potentially mitigate any impacts. I believe however that this project should not go ahead.

GEOB 270 Lab 4

dataclass

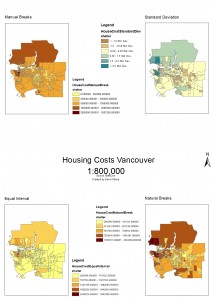
Q8.  Different classification methods portray the same data differently as shown by the above maps. All these maps were made using the exact same data but using different classification methods. As a real estate agent I would use natural breaks because it clusters similarly priced areas in to classes. So all areas of similar housing costs are colored similar giving clients a good idea of housing costs at a glance. As a journalist I would use standard deviation because it clearly shows how far off the mean housing costs differ across Vancouver or Montreal. There are ethical implications yes, because by using different classification methods you can present the data in a manner which benefits the goals you are trying to achieve. Whatever that goal may be.

affordability

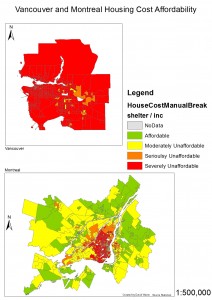
Affordability in this case describes the cost of a dwelling unit (median) normalized to the median income. So it shows how much income per census tract versus how much each dwelling unit costs. This is a better measure of affordability than housing cost alone because it shows how much income can be spent on housing per census tract.

The housing affordability categories are Severely Unaffordable, Seriously Unaffordable, Moderately Unaffordable, and Affordable. These classifications were produced by The NYU Urban Expansion Program which is a think tank and urban action center of the Stern School of Business at the New York University. I would call this group trustworthy because they are an academic group whose goals are to aid municipalities and urban areas in planning for their future urban expansion. I would say that affordability is a useful tool in determining livability but not the only one by far. It plays a role but other factors such as safety, healthcare, education, proximity to work and leisure etc play larger roles I would argue in determining livability of a location.

GEOB 270 Accomplishment Statement

Lab 1
The purpose of Lab 1 was to introduce new users to ArcGIS and help them become familiar with the system. To give broad and general knowledge of how to use a GIS system.  This was to be accomplished by following a tutorial and using ArcGIS in a hands on manner. I believe that I accomplished this quite successfully. I am fully capable of getting data, checking it, modifying it, and using it in ArcGIS. Also at the end of Lab 1 I had a basic fundamental understanding of how to use ArcGIS.

Lab 2
In Lab 2 we began to work more in depth with ArcGIS and its systems. The purpose was to learn about projection systems, coordinate systems, and working with remote sensing date. This lab helped me to understand the various ways in which visual data can be displayed and manipulated in ArcGIS. At the completion of the lab I was able to create a visual comparison before and after of Mt St Helens. This lab provided me with the tools to turn data into something that can be used in analysis.

Lab 3
Lab 3 was a lesson in creating a functional product in GIS that can be used in analysis. We were to take data, and use it to help solve a problem. The problem of tsunami impacting Vancouver. The data was taken and combined in such a way that by the end of the lab a useful map was produced. This map accomplishes the basic tenant of GIS, to take data and combine/present it in such a way as to provide a tool for meaningful analysis.

GEOB 270 Lab 3

Question 5

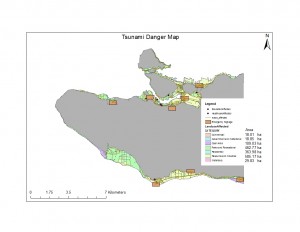
I was able to determine that roughly 8.25% of Vancouvers land area would be affected by a tsunami in this scenario. This was determined by calculating the total land area of Vancouver. Determined using the VancouverMask layer and using statistics to find the areas shape. Using the statistics on the affected areas layer I got the total area affected by the tsunami. Dividing these numbers got me the percentage of Vancouvers total land area affected.

Question 6

Schools Affected

Emily Carr Institute of Art and Design

Henry Hudson Elementary

False Creek Elementary

St Anthony of Padua

Ecole Rose des Vents

Healthcare Sites Affected

False Creek Residence

Villa Cathay Care Home

Yaletown House Society

I was able to determine the sites affected by selecting all the points of healthcare and education in Vancouver. Then using select by attribute, select by area. The area used to select the attributes was the affected landuse layer. I created a layer only using the points selected in the affected area. Opening the attribute table for these new layers I could see the names of each specific location.

mylab3

GEOB 270 Lab 2

When dealing with various data sources and files you must always make sure your data is compatible. So all the units should be the same and your coordinate and projection systems should be the same across all files as well. This makes sure that once your various layers and data files are collected into one map the entire collection works together to make a concise and legible map that serves its defined purpose. The following steps are necessary to ensure this happens. First you would check to make sure all the data files were on the same coordinate systems/ projections. If not you must make them so. Next you would make sure all units were matching, ie all in meters or all in kilometers for linear data, all degrees for angular data etc.

Remotely sensed landsat data is extremely useful for geographic analysis. It allows one to view a large area at once. It also contains various color layers that can be adjusted to highlight different changes in the landscape. The timescales of landsat data is also useful. Since the seventies lansat data has been collected in steady intervals. This allows us to see the change in landscapes over short time scales as well as long scales.