Droughts are characterized by a lack of precipitation over an extended period of time, resulting in extreme water shortage. Scientific findings suggest that droughts are a consequence of natural climate variability but climate change caused by anthropogenic activities have greatly amplified its severity. California alone has experienced many droughts; each period being more severe than the previous. As the most populous state and a major agricultural producer in the United States, droughts have a severe economic impact as well as environmental.
Our project, The Effects of Kern’s Agricultural Industry Due To Changes In Climate Conditions was inspired by our interests to find out how and if climate change has impacted California’s agriculture industry by correlating drought patterns with agriculture growth. We will focus this study on Kern County because it is one of the largest agricultural counties in Central Valley, California. The county contributes an average of 6 billion dollars to California’s economy each year. With alfalfa, almonds, grapes, oranges and pistachios being the top crop commodities.
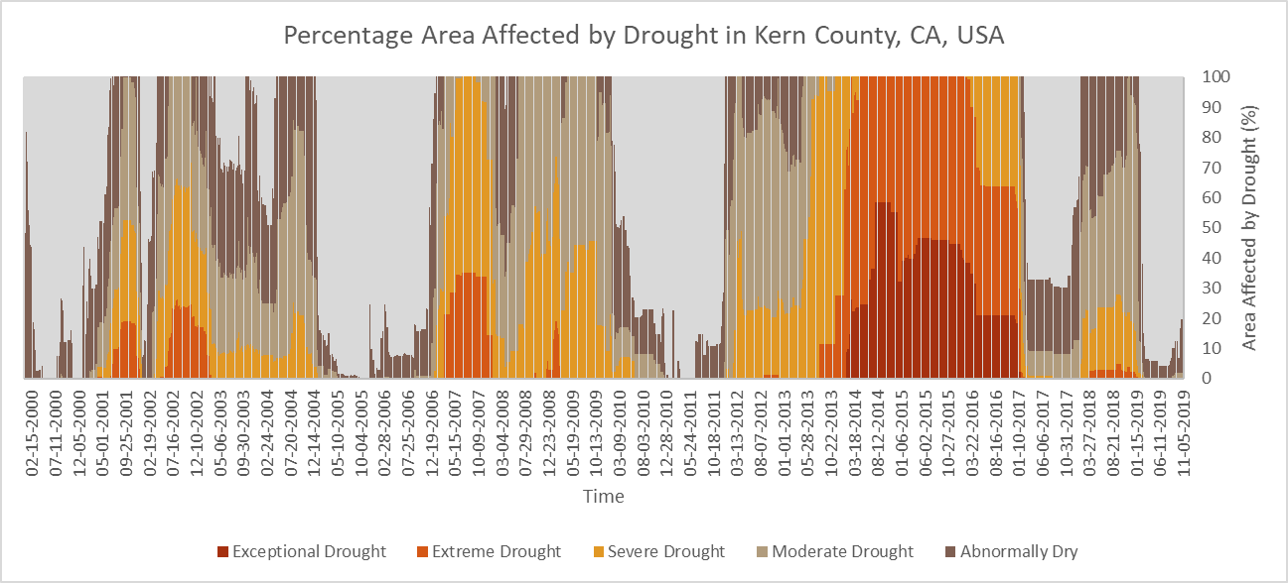
We chose the study years of focus by compiling climate data onto a time series plot (Figure 1). Using this, we were able to pinpoint dates where drought conditions were most prevalent. We choose 2007 and 2014 as our two years to compare where 2014 was the more severe drought year between the two years. Both years belong to two different drought periods. 2007 to 2009 saw three years of drought conditions and 2011 to 2017 was the driest in California’s history.
The goal of our project is to create a map that shows a relationship that drought conditions lead to significant changes in how agricultural land is used. We aim to demonstrate specifically how 2014 has been impacted and hypothesize that the more severe a drought is, the more negatively farms will be impacted. We will support our findings with a crop comparison map, drought comparison map, and Normalized Difference Vegetation Index (NDVI) map. The NDVI will show us how crop health has changed between the two drought years.