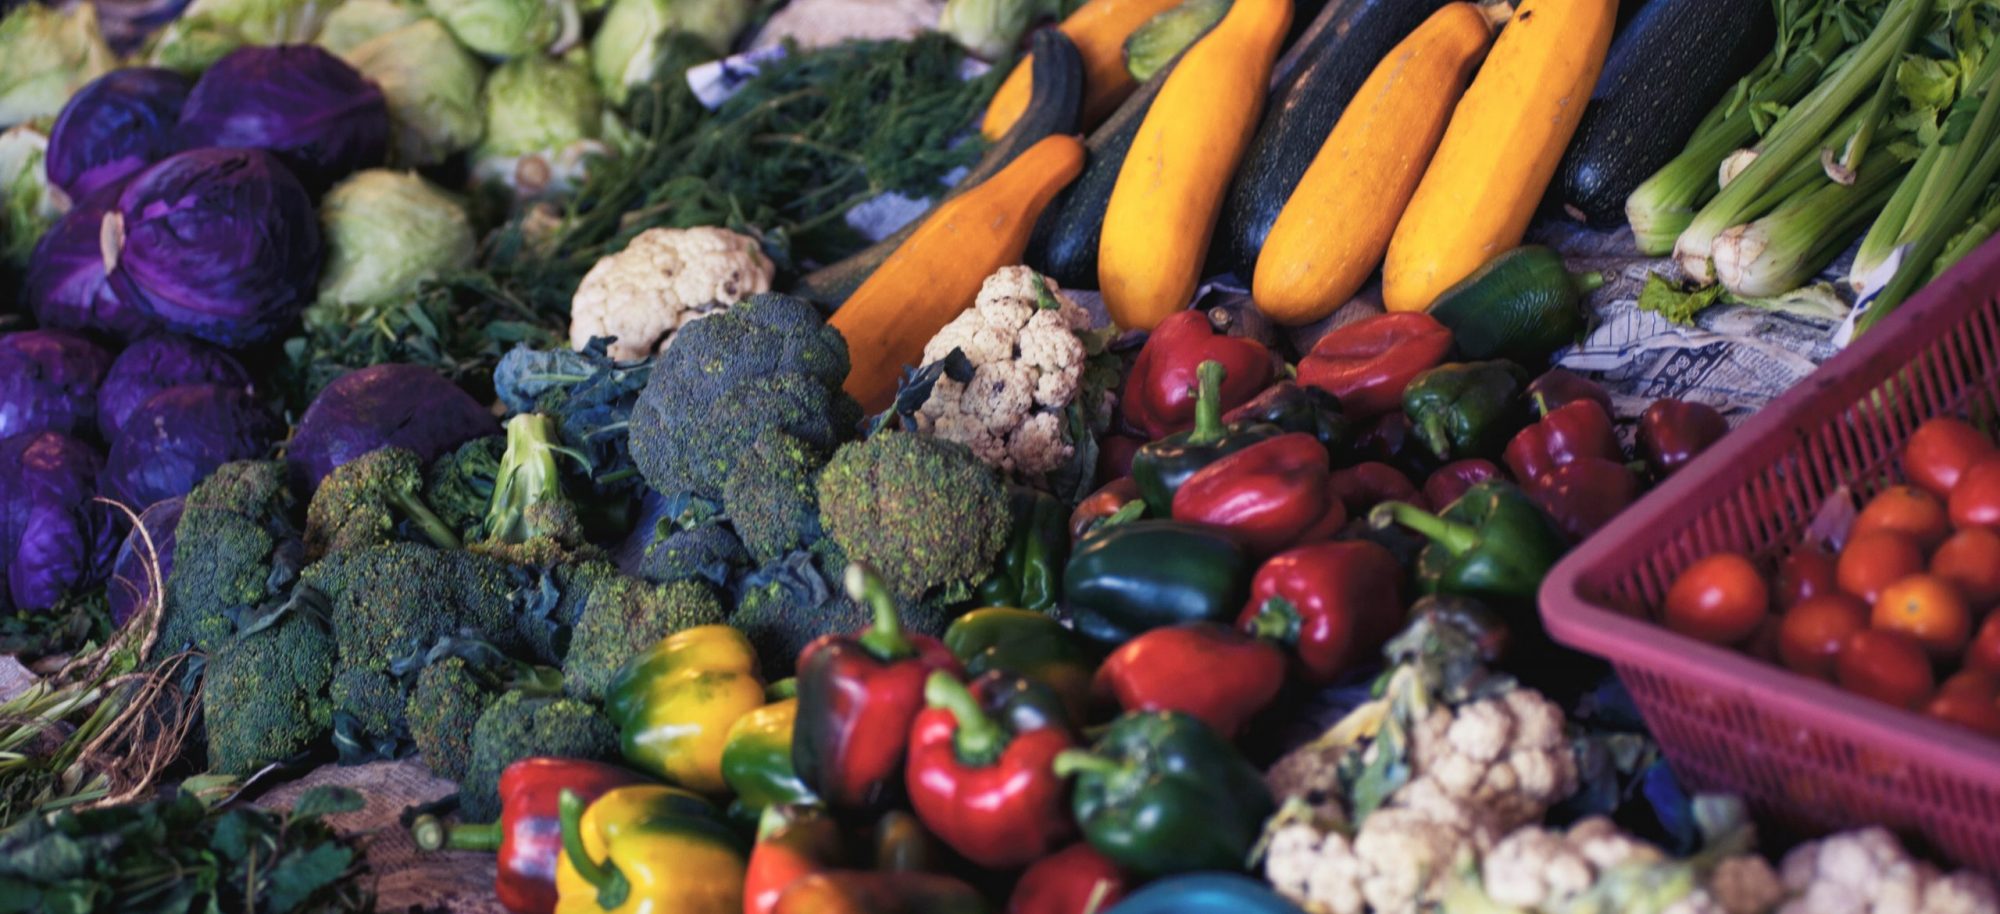
The Normalized Difference Vegetation Index (NDVI) utilizes red and infrared (IR) bands to create an image that shows the condition of vegetation. An NDVI is commonly used to “monitor drought, monitor and predict agricultural production, assist in predicting hazardous fire zones, and map desert encroachment” (ArcGIS). Differences in the reflection of red and infrared bands allows us to see the density and intensity of green vegetation growth using the spectral reflectivity of solar radiation. Healthy green vegetation will appear dark green in an NDVI while vegetation that is stressed, diseased, or dead appear more yellow as it reflects significantly less in the near-infrared range (ArcGIS). Therefore, the equation that calculates NDVI is (NIR-RED) / (NIR+Red).
Generating an NDVI of Kern County in 2007 and 2014 not only allows us to see how dense and healthy crops are, it also allows us to compare the two drought years. However, by comparing the maps, we are assuming that the crop types did not change, which is untrue. We also created an NDVI for 2011 as our “average” year – where no drought conditions were reported.
In order to obtain these images, we first downloaded Landsat images through USGS Glovis. For 2007 and 2011, we used images acquired by Landsat 5 TM and for 2014, images from Landsat 8 OLI was used. Due to the location of Kern County, four different scenes were required in order to encapsulate the entirety of Kern: 1035, 1036, 2035, and 2036. In ArcMap, we created composite band images of all four of the map scenes. Bands 4-3-2 were selected for Landsat 5 images and bands 5-4-3 for Landsat 8 (near infrared – red – green). Next, we used the Mosaic tool to combine the images together for the three different years. To extract data only pertaining to Kern County, we used the clip function and overlayed a boundary shapefile of the study area. Finally, we were able to create an NDVI for all three years.
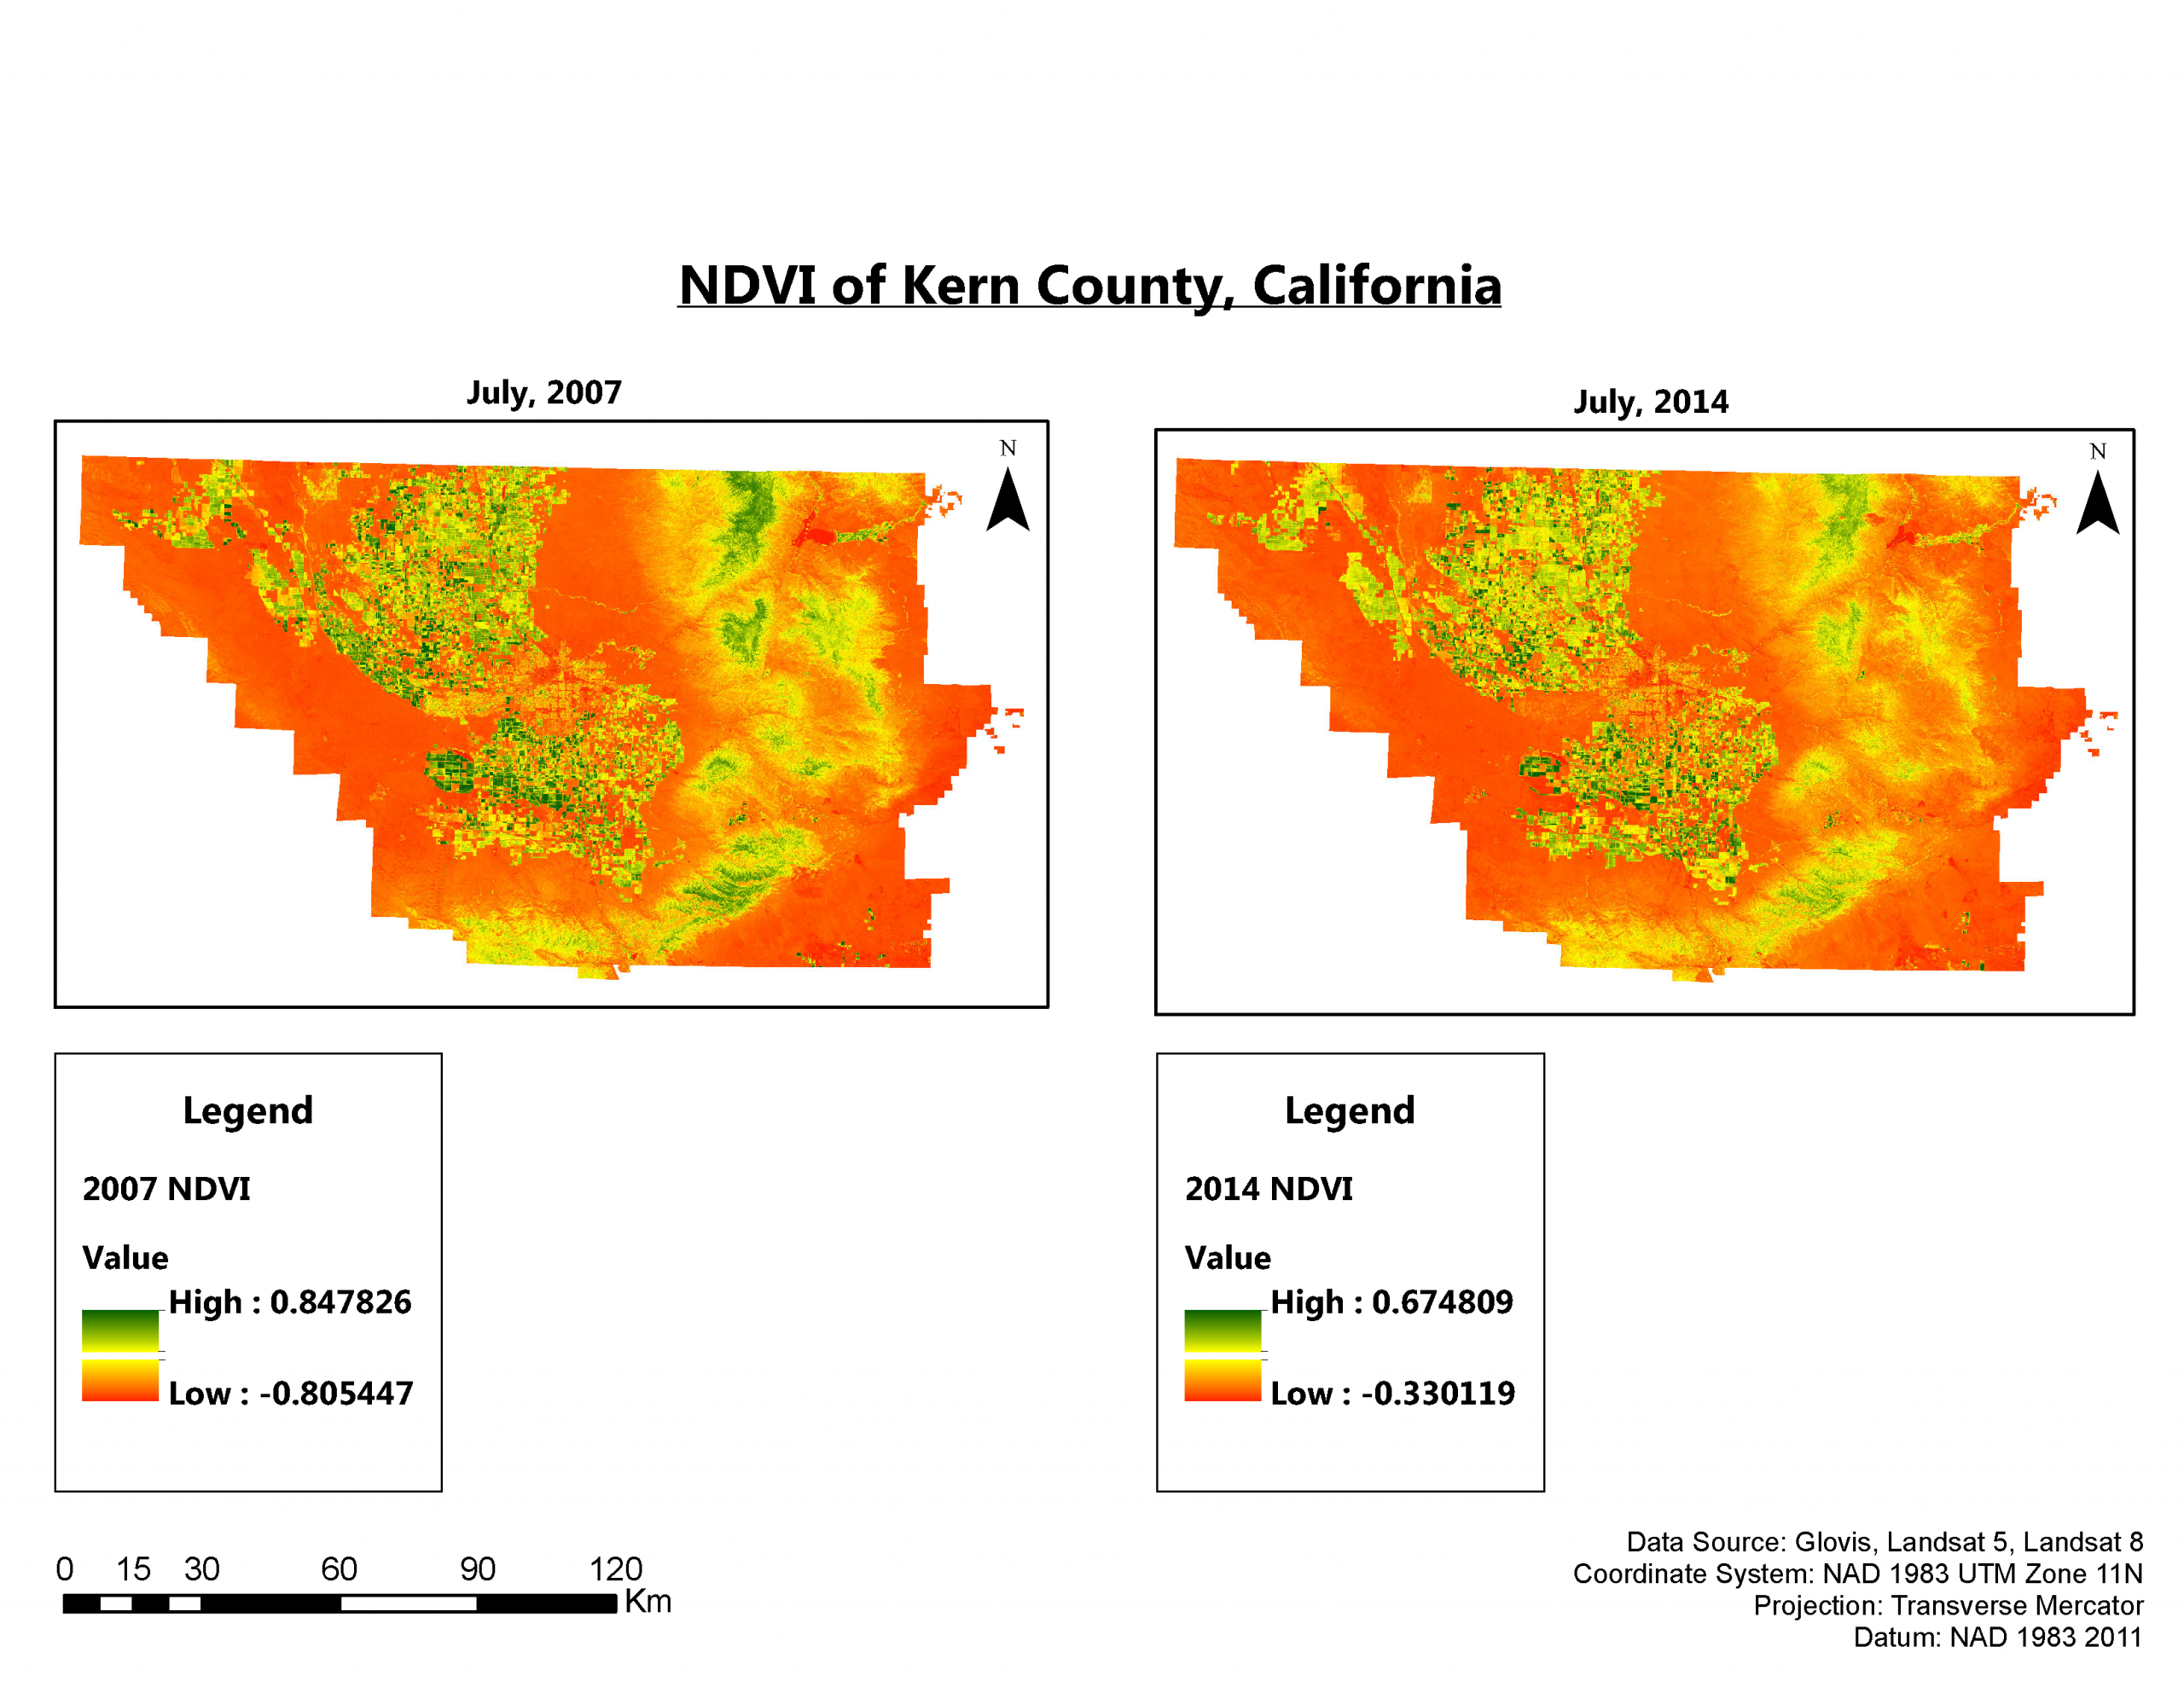
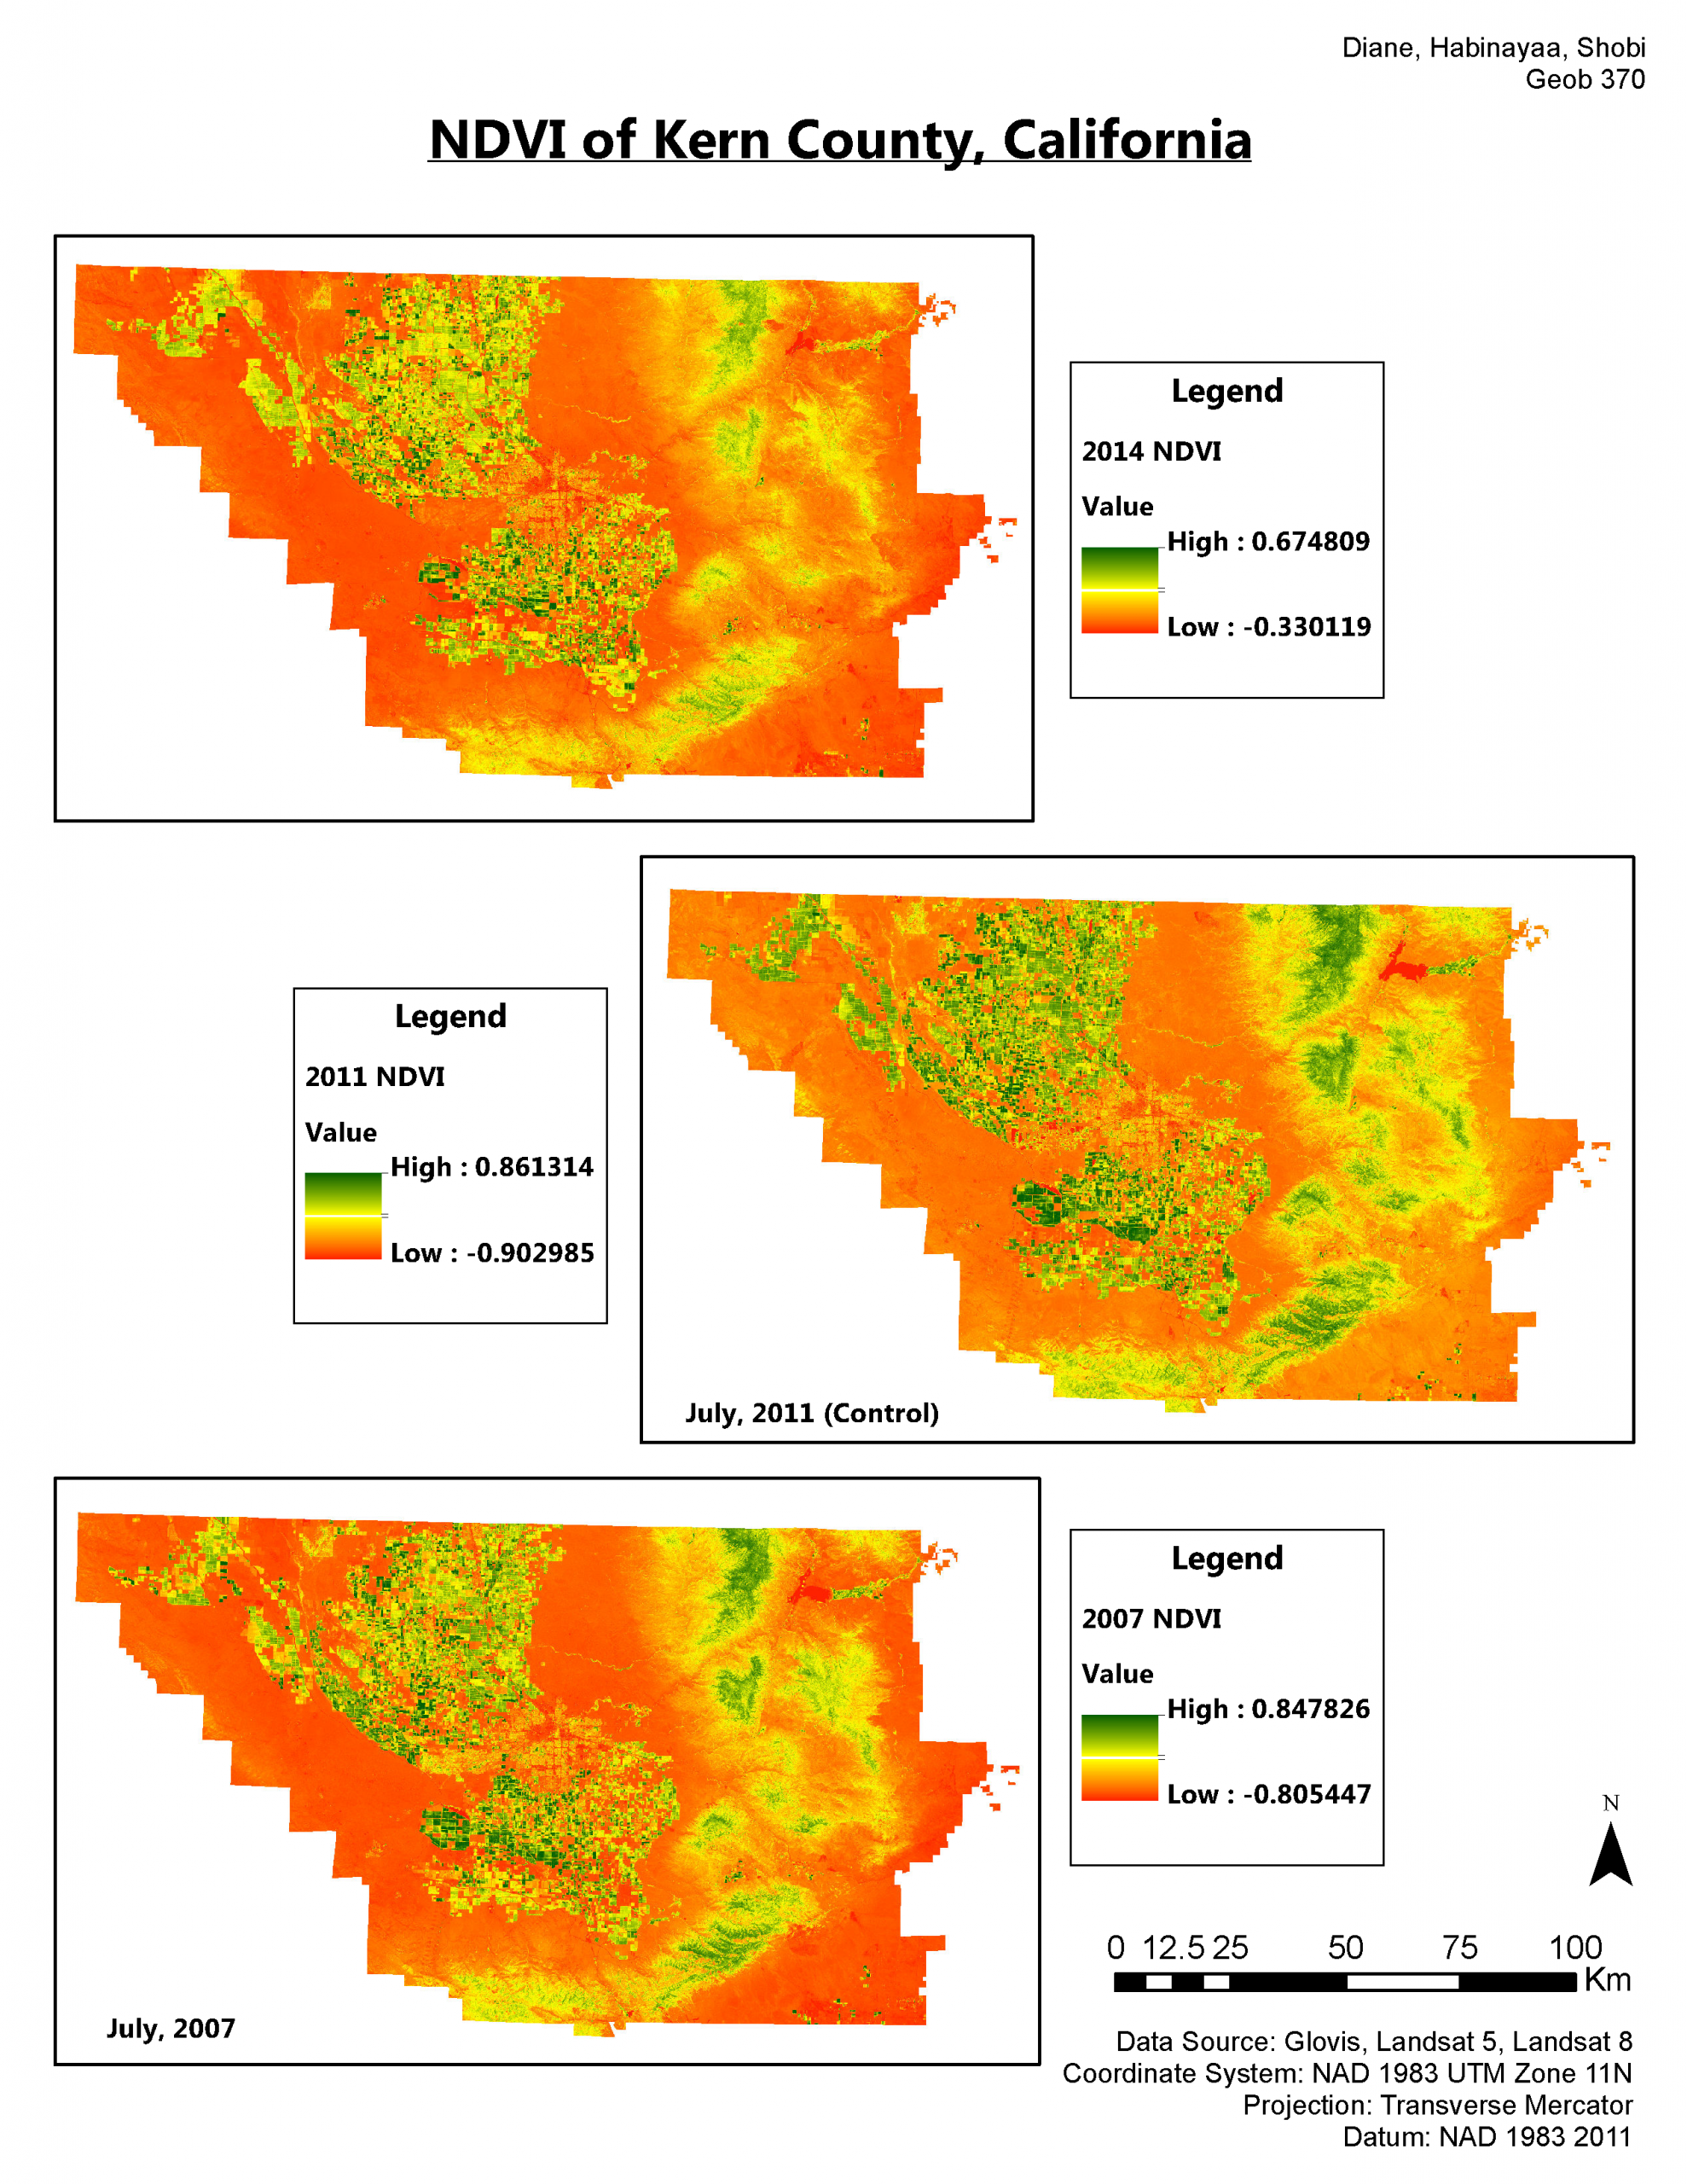
NDVI values range from -1 to 1 where a high positive value indicate healthy and/or dense vegetation, low positive value indicate unhealthy and/or low density vegetation, and negative values correspond to barren areas of rock, sand, or urban/built-up areas. When comparing the 2007 NDVI to the 2014 NDVI, it is important to note that the range in values are different for both maps and we assume that the crops have not changed between the two years. We must also take into account that different crops reflect different amounts of visible and near-infrared light, meaning that “healthy” for one crop could have a dissimilar value as another crop. With that being said, in Map 1, the 2007 NDVI includes a high of 0.85, which generally indicates healthy vegetation while the 2014 NDVI has a high of 0.67 broadly indicating the vegetation may not be as healthy. The NDVI map of 2007 has more “green” space; particularly in the center left of the farmland area as well as the top right area where a section of the Sierra Nevada Mountain Range is situated. This indicates that though both years are considered drought years, we can conclude that 2014 was more extreme. This is also consistent with our drought time series map and drought maps. Map 2 includes the NDVI of all three years, 2014 at the top, 2011 in the middle and 2007 on the bottom. It is clear that in the 2011 NDVI, there is a higher quantity of “green” space spread throughout the map, including crop land on the left and the mountain range on the right. Furthermore, when comparing the two maps to 2011, our control year where no drought conditions were reported shows that the highest NDVI value is 0.86, slightly higher than in 2007. This shows that drought conditions are likely to impact vegetation health.