Due to differences in the NDVI range of values, we also decided to use the raster calculator to find out the difference of values from 2007 to 2014. We were able to subtract the pixel values of 2007 from 2014 to show where the vegetation increased, stayed the same, or decreased in health. Moreover, this function quantifies areas of change through pixel counts in each class, allowing us to calculate the area of change detected in each class.
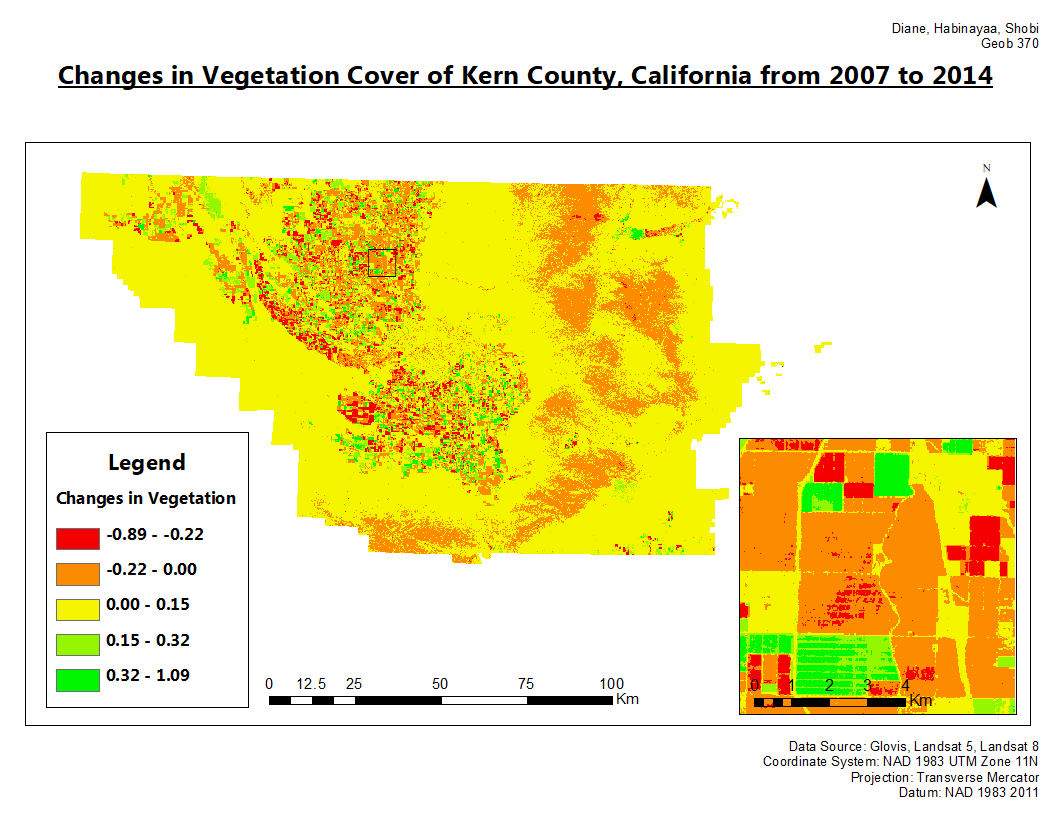
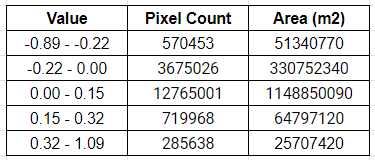
We classified the range into 5 classes using natural jenks classification method. Class one included values -0.89 to -0.22, class two -0.22 to 0.00, class three 0.00 to 0.15, class four 0.15 to 0.32, and class five 0.32 to 1.09. As shown in Map 1, class one and two show areas that had a negative change, meaning the vegetation decreased in health from 2007 to 2014. Class three, four and five show areas that had a positive change, meaning the vegetation increased in health from 2007 to 2014. However, class three shows areas that had very little changes between the two years. As viewed on the map, most of Kern County shows that there was very little change between both drought years. More specifically, the land area of class three covered approximately 1148.85 km^(2). Class one covered approximately 51.34 km^(2) and class five covered approximately 25.71 km^(2). Table 1 shows the pixel count and area in meter squared of all the class values.
As mentioned, we know that different crops reflect different amounts of visible and near-infrared light. We also know that some crops were converted to other more drought-resistant crops from 2007 to 2014. Therefore, we must take extra caution when analyzing the changes in vegetation. The inset map in Map 1 includes a section of the crop land in the northern part of Kern County where the crop type did not change. Almonds were grown consistently in 2007 and 2014 (Map 1 in Comparison of Data). The inset is included as an example to show how one area where the crop did not change, saw a decrease in health in 2014 compared to 2007.