Proposed Thesis Title:
Modelling the 21st Century Change in Ski Season Length at 150+ Western North American Ski Resorts Under RCP4.5 and RCP8.5 Greenhouse Gas Emission Scenarios
Climate Change Impact Assessment
Climate change is impacting many facets of everyday life, our focus is on some of the potential socio-economic impacts that are seen today and will continue to be effected in the future. The ski industry (while our primary focus is North America) is a crucial component in some countries tourism industry that accounts a large user base worldwide. The community surrounding winter sports has grown into advocates of reducing the impacts of climate change. While research has been conducted on winter sports and a changing climates effect on temperature and precipitation, our goal is to expand the scope of the issue with a unique take on the impacts on ski resorts. Our goal is to model the changes in the length of ski season into the future (2025, 2055 and 2085) under two different representative concentration pathway (best case scenario RCP4.5 and worst case scenario RCP8.5) emission scenarios outlined by the International Panel of Climate Change.
Climate databases ClimateBC and ClimateNA are used to generate historical monthly mean temperature data for the period 1981-2010 for 150+ selected ski resorts in Western North America. These databases are also used to generate climate model forecasted monthly mean temperature data using an average ensemble of the 15 models available in the database. This data is used to forecast three years: 2025, 2055 and 2085, for two different emission scenarios: RCP4.5 and RCP8.5. The base (climate normal) period of 1981-2010 is compared to the different emission scenarios to analyze change.
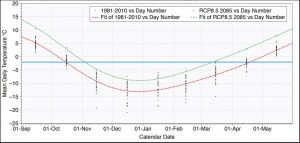
A polynomial regression is used to generate daily mean temperature curves for each resort for each emission scenario for future periods and the base (climate normal) period. A threshold mean daily temperature of -2oC is used to define the start and end of the season, the temperature at which artificial snowmaking is possible. Start and end dates are determined through intercepts of regression and threshold temperatures and stated numerically. Geographic Information Systems (GIS) and other visualization/statistical programs are being explored to create visualizations and conduct spatial and statistical analysis of the results.
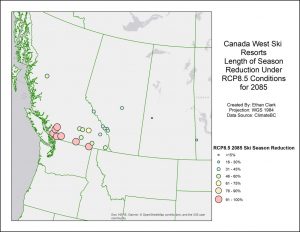
Below is an example of the polynomial regression visualization and a preliminary ArcMap (GIS) visualization of Western Canadian Resorts, all under RCP8.5 conditions for the year 2085.
Supervisory Commitee:
Dr. Michael Pidwirny (Supervisor)
Dr. Ian Walker
Dr. Mathieu Bourbonnais
For a little more scope on the work we’ve been doing refer to Dr. Pidwirny’s website: