Memorandum 5
Date: March 2nd, 2014
To: Professor David G. Michelson
From: EECE 380’s L2D4 Group
Subject: Weekly Memo for Week 5
This week the group focused on compiling all the parts together and testing the project by inputting a RF signal between 50-54 MgHz with power level varying between -60dbm to -20dbm.Upon testing we came upon few unforeseen issues within the software which we are currently working on.
Hardware Sub-group
The goals of the team for the week were
- All the goals for the hardware sub group have been completed.
Cascaded Common Emitter Amplifier
Upon testing with a range of signals it was decided that the current quality and quantity of the amplifiers are sufficient.
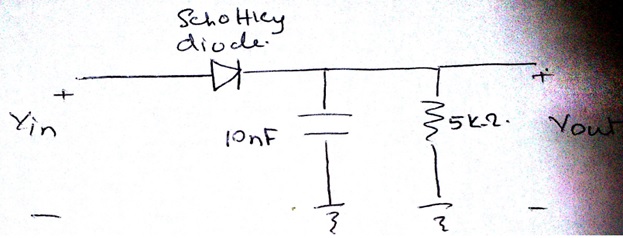
Precision Peak Detector
The peak detector works within the full range of power, -60 to -20 dbm. Previously we had issue with detecting the signal at -60dbm but with further adjustments we can now detect the signal at that power.
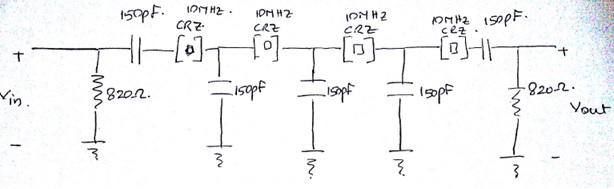
Video Filter
From the feedback of our previous tests we have incorporated the video filter within the lab view architecture.
One issue we had last week was the transportation and movement of all the different parts of the project. This week we constructed an enclosed box to contain all the wires and circuits so that the project remains connected and operational thus increasing the efficiency. Also now the project can be transported without any interference.
Software Sub-group
The goals of the team for the week were
- Calibrate the frequency domain on the display so it displays the correct RF frequency.
- Calibrate the power domain on the display so it displayed the correct RF power.
Display
We have resolved all the previous issues with the display but upon testing the full project it was discovered that the frequency being displayed differed by some unknown factor from the test signals frequency. To resolve the issue we have started to calibrate the frequency on MyDaq by recording the values at numerous test points onto an excel file. By drawing a graph of this data we can calculate the relationship between the actual frequency and the frequency being displayed on MyDaq.
Video Filter
The video filter is completed by using a design block Butterworth filter and setting it to be a low pass filter. The high cut-off frequency we choose is 1.1MHZ. Testing of the video filter will be performed in the next week.
Logarithmic Amplifier
We had the same display issue with the logarithmic amplifier as well. The power being displayed differed from the power being inputted. To resolve this issue we took the same approach as before. We recorded numerous values at various test points in order to calculate the relationship between the power and its display error.