Percentage in Danger:
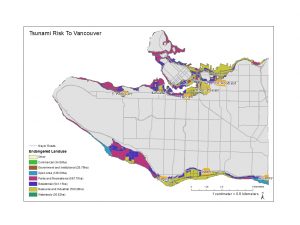
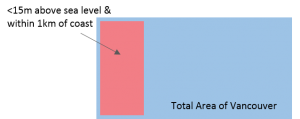
From this map, it is possible to see that 15.5% of Vancouver is at risk of a Tsunami. This figure comes from comparing the area in danger of a tsunami with the total area of the city. The places in danger from a tsunami are defined as areas that are 15 meters or less above sea level and within 1km of the coast. By mapping both this danger zone over a background map of Vancouver, it is possible to visually assess the proportion of Vancouver in danger. To mathematically calculate the percentage at risk requires identifying the total area in danger:
- right click on layer > attribute table > highlight area column > right click > summarize > note “sum” value)
- divide this by the total area of Vancouver (using the same method for identifying the total area as before)
- Multiplying the result by 100.
Simplified visual depiction of process:
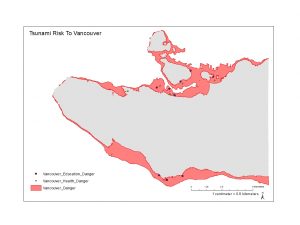
Within this danger zone, there are 10 educational and 5 health care facilities at risk:
Health Care Facilities at Risk:
- False Creek Residence
- Villa Cathay Care Home
- Coast West Community Home
- Broadway Pentecostal Lodge
- Yaletown House Society
Educational Facilities at Risk:
- Emily Carr Institute of Art and Design (ECIAD)
- Institute of Indigenous Government (IIG)
- Henry Hudson Elementary
- False Creek Elementary
- St Francis Xavier
- Vancouver Montessori School
- St John’s International
- Heritage 3R’s School
- St Anthony of Padua
- Ecole Rose Des Vents
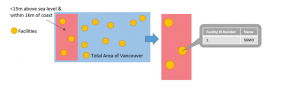
These facilities were identified by adding all of the health care and educational facilities to the map of Vancouver and then selecting only those facilities falling within the previously defined tsunami danger zone before generating a table to read the names of endangered facilities from.
Select all of the facilities in the danger zone and create a new layer. A layer is a slice of the information from the map, selected based on a common theme – e.g. a layer showing schools. Each of the new layers displays only facilities within the danger zone.
- Clip the education and health facility layers to the danger zone area using the clip tool from within ArcToolBox
- Two layers are produced, one of the endangered health facilities and the other of the endangered educational facilities
Open the attribute tables of these endangered layer and the names of the facilities can be read off in turn
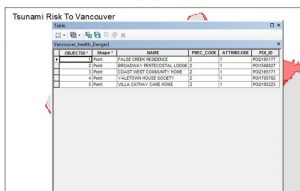
Simplified visual depiction of process below: