ArcGIS

Final Project Report

Greater Vancouver Accessibility: Description of Project, Study Area, and Data

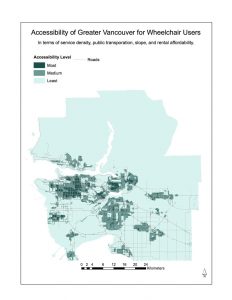
Accessibility of Greater Vancouver for Wheelchair Users (includes slope, rental affordability, public transportation and service density)

Accessibility by Rental Affordability, Public Transportation and Service Density

The following report will provide an in-depth analysis of maps created in ArcMap GIS to evaluate accessibility in Greater Vancouver and the City of Vancouver, critiquing the data, methodology and analysis tools employed. Quantitative data sets, including raster and vector files, will be used to generate choropleth maps, heat maps and plot point data. We will use slope standards for ramp manufacturers, combined with a street maps and transit stop point data to generate a map highlighting zones of greatest physical accessibility in Vancouver by constructing “accessibility buffers”. Therefore, we define physically accessible areas as those that lie on streets within a certain distance of a public transport stops (SkyTrain and bus), based on City of Vancouver and Coastal Health guidelines. Yet, we will problematize this narrow notion of accessibility by combining our physical analysis data with indicators of social and economic accessibility, namely service accessibility and normalized rental costs. For the purposes of this analysis, the following definitions and assumptions will be employed:

  • Individuals only have access to public transportation including busses and the SkyTrain;
  • Physical disabilities will be will be defined as any limitation on a person’s functioning, mobility, dexterity or stamina that significantly impacts or more major life activity (Study.com, 2016);
  • The average speed of an electric/powered wheelchair is 8 kmph, exceeding the average walking pace of just 3.1kmph (Hoveround.com, 2013);
  • An “accessible” distance away from a bus or SkyTrain station is considered to be 5 minutes;
  • The slope of an area will be considered “accessible” if it has an 8% rise or less (Building Access Handbook, 2014).

The datasets that will be employed come from a variety of sources including VanMap, British Columbia Research Library Data Services, Vancouver TransLink, the University of British Columbia’s Department of Geography database, and Statistics Canada about accessibility. The below list of featured spatial datasets will aid in assessing which areas of Vancouver are deemed most accessible:

  1. A list, distribution map and point data for all TransLink bus stops in the Metro Vancouver Area;
  2. A list and distribution map of all schools, community centres, health care facilities, cultural spaces, and public parks in the Metro Vancouver Area;
  3. A digital elevation model (DEM) for the Metro Vancouver Area;
  4. A spatial map of all Metro Vancouver roads; and
  5. Census tract data concerning the rental affordability of housing in Metro Vancouver.

The most accessible areas in Vancouver will be determined based on their proximity to each of the amenities and resources listed above, as well as local housing prices. While there are many aspects that impact accessibility, we contest that geography and topography are integral when it comes to making a decision about where to position one’s self as a physical disadvantaged, independent individual that relies on public transport. Thus, the priority for determining the accessibility of an area will be based on distance from public transportation, services, and the slope or gradient of roads or sidewalks in the area. Combining these data sets, we will identify physically accessible areas, overlaying clustered services and lower cost areas to determine a compromised, broader accessibility.

Compiling our spatial findings to identify service gaps, our report will function as a guideline for locating additional residences and services, as well as identifying locations that should enact especially strong building regulations based on their zone’s geographical and physical accessibility.

HYPOTHESIS

Based on our existing understanding of the socioeconomic and physical geography of the Metro Vancouver and the different factors we intended to explore, we predict that Downtown Vancouver and Kitsilano are the most “accessible”.

METHODOLOGY OF ANALYSIS

Our project focused on two scales: the city of Vancouver, defined by the municipal government, and the Greater Vancouver area, as defined by census Canada. In order to compile census, municipal, and institutionally-gathered information to determine spaces of accessibility, we use used ESRI’s ArcMap 10 software to compile layers, edit information and perform normalization calculations. In order to compile this information, we used a wide variety of spatial tools including clip, intersect, merge, union, raster-to-polygon conversion, dissolve and project. We also performed non-spatial analyses, using the field calculator and the select-by-attribute function.

To determine accessibility at the smaller scale of Greater Vancouver, we initially combined elevation data in the form of a Digital Elevation Model (DEM), hydrology, roads, bus stops, and rapid transit stations, creating buffers around the combined transit stops. We created 2 buffers, the first of 129m and the second of 417m. 129m represents a 5-minute distance for those using a manual wheelchair, based on the average push speed of 8.6 mps, (Sonehblum et al., 2012). The second buffer of 417m indicates a 5-minute radius, determined from an average walking pace of 5km/hour, as electric wheelchairs and scooters able to exceed this speed for over 20 minutes (Hoveround.com, 2013). Areas outside of these two buffers were deemed least accessible.

We then used the DEM to create slope information. Due to the DEM’s pixel size of 25m, we considered maximum ramp grades for ramps exceeding 25m. Using the guidelines of the British Columbia Building Access Handbook from 2014, the maximum gradient for accessibility was determined to be 1:12, or approximately an 8% incline. We used this grade to remove areas that were too steep for a manual wheelchair user from within the 129m buffer.

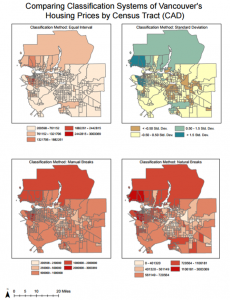
However, we argue that accessibility is not merely physical, but must consider the social and economic dimensions of accessibility. To this end, we incorporated housing price data as a loose surrogate for economic accessibility, using median rental prices over census tracts collected by Census Canada. We normalized rental costs by the average number of rooms for the census tract.

To address some of the social wellbeing dimensions of accessibility, we incorporated service information. Using point locations for health and education services, we created a density map across the region to identify sites of service clusters, setting the parameters of the raster layer to the extent of Greater Vancouver and the cell size to 25m, in keeping with the DEM and acknowledging the ground extent of buildings.

Having spatialized the information of these three forms of accessibility (physical, economic and social), it was evident that the accessibility criteria yielded often contradictory accessible spaces. Seeking to explore the compromise between these three components, we classified each layer using natural breaks and three classes. We assigned new values between one and three for each of these classes, one being the most accessible (cheapest rental, most services or within the most constrained buffer zone) and three being the least accessible (most expensive rental, least services or outside of the two transit-accessible buffers). With these normalized values it was possible to combine the three layers – using the union tool – to derive a single score.

The greatest accessibility was clearly within Vancouver and a greater array of socio-cultural feature information was available for this larger scale, spurring us to develop a map of the City of Vancouver. The additional features included were community gardens and farms, cultural spaces, homeless shelters, and community centers. Combining these with existing information on education and health, we created a new density map, classifying it once more into three classes using natural breaks.

We clipped the existing physical accessibility information and normalized rental rates to the city of Vancouver extent. We reclassified the rental rates, using natural breaks and assigned normalized values of one to three for each of the classes, repeating this classification between one and three for the physical accessibility and service layers. Finally, we unioned the physical, economic (housing) and sociocultural (service) layers, calculating a common, composite accessibility score and symbolizing accessibility using manual breaks to determine accessibility in the City of Vancouver.

DISCUSSION & RESULTS

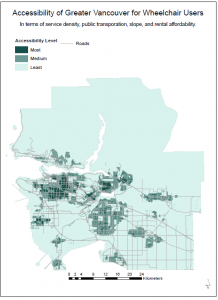
Our analysis led to the creation of 4 maps, and aided in highlighting a variety of key trends. Each of the layers and datasets included illuminated various facets of accessibility in Vancouver; when all of these layers are taken into consideration, there are few arguably “accessible” areas in Vancouver as seen in fig. 4. General trends show that the most “accessible” regions of the City of Vancouver in terms of slope, distance to transit stops, access to services include Yaletown, the Downtown Eastside, and Strathcona. If we consider the Greater Vancouver Area as a whole, commercial centres in Surrey, Delta and New Westminster are also considered to be accessible.

Most Accessible Neighbourhoods in Metro Vancouver

(Slope, Access to Transit, Service Density)

  • Yaletown
  • Downtown Eastside
  • Strathcona
  • Olympic Village (and immediate surrounding area)

Fig. 2 is a map that helps visualize the regions that have been deemed accessible solely based on slope and proximity to transit. Regions that fall within the medium shade of blue indicate the areas that fall within the ‘accessible’ buffer zone or distance, which has been deemed 417m. Within this 417m range, we have also defined a smaller range of 129m that applies to individuals using a manual wheelchair who are not able to travel as quickly in a 5 minute time period. This map also highlights areas that are out of range, usually accounting for regions that are not accessible by transport, but also very steep. These regions include places like Wreck Beach, Tower Beach, and the south-western corner of Vancouver.

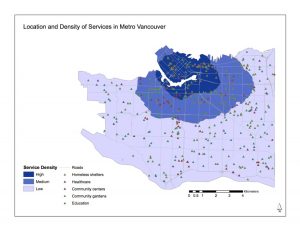
In looking solely at services (fig. 1), it is apparent that the downtown core of Vancouver has the highest density of services. These services include health care facilities, community centres, community gardens, education facilities, and homeless shelters. Density in the form of a heat map, as well as point data are provided in fig. 1 to allow the reader to understand distribution specifically and as an average. The map clearly shows that the farther away from the downtown core one moves, the lower the density of services.

One important aspect to note is that there are more homeless shelters clustered in the downtown area, specifically the Downtown Eastside. Not only may this have skewed the data and increased the average and density, but is indicative of larger socioeconomic trends in the city. This area has a higher than average (compared to the rest of the city) homeless population, which accounts for the presences of homeless shelters. While geographically this area may be most suitable and accessible for people with mobility issues, there are other qualitative factors that may deter individuals from living or working in a certain area.

Another area whose services cater to those with mobility issues is the corridor that runs North-South between Granville Street and Cambie Street. This is best seen in fig. 1 when looking at the region where the density of services transition from Medium to Low. Provided that proximity to healthcare was a primary concern, this area would considered very desirable; however, there is a new hospital and variety of healthcare facilities that are being constructed in the region with the highest density of services, making the area perhaps more accessibility with those who require immediate health care to help cope with their mobility issues.

Most Accessible Neighbourhoods in Metro Vancouver

(Slope, Access to Transit, Service Density AND Rental Affordability)

  • Downtown Eastside
  • Strathcona

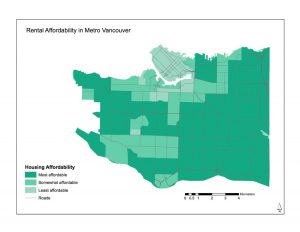
Beyond looking at the locations and densities of service, it is important to understand that accessibility is not only about the physical limitations, but potential socio economic and monetary constraints further limit accessibility, problematizing notions of merely physical accessibility.  To provide some more background information and insight, please see Figures 1.1 and 1.2 in the appendix, as they indicate the average rental rates in Vancouver as well as the amount of disability income for which individuals are eligible. This indicates that the maximum about of shelter monetary assistance that could be provided is $1093.06/month, which is less than the average rental rate for a 1 bedroom apartment in Vancouver as seen in Figure 1.2 at $1,832/month. While fig. 3 doesn’t include the Greater Vancouver Area, it is important to note that rental rates for housing outside of the Vancouver core are substantially lower, averaging $861/month.

Spatializing this tabular concerns in fig. 3 reveals that, in the case of Vancouver, economic factors of accessibility often conflict with physical and social accessibility, necessitating a compromised notion of accessibility. These trade offs between economic accessibility and socio-physical access, highlight the need for a multidimensional definition and approach to urban accessibility. Thus, identifying the compromise of accessibility underscores the need for more than the mere provision of public transportation to increase affordability, and instead the directed implementation of transportation and service location in areas of south Vancouver and Richmond with higher rental affordability and more accessible land, as determined by slope.Likewise, noting physical and service accessibility in Metro Vancouver in contraction to housing accessibility, contests a spatialized right to housing, with a right to housing – not only in Greater Vancouver – but in the socio-physically accessible downtown core.

ERROR & UNCERTAINTIES

Because we conducted no primary data collection, our analysis relied entirely on secondary data. Though we used well-established municipal or educational sources such as VanMap, Stats Canada, and the UBC data drive, some layers were not transparent about the methods of data collection and any potential errors in the data. Because of this and our lack of empirical testing, it is difficult to calculate errors in our data, although they likely exist. Much of the municipal data is updated regularly, but the timing of data collection was not standard between layers, which may have lead to outdated or inaccurate data. Additionally, the difference in timing between layers means that we cannot say our model is accurate to a particular month or year, including the present.

To create our slope layer, we relied on a Digital Elevation Model with a pixel size of 25 metres, which is larger than many of the small point features like transit stops that we are studying. This degree of generalization brings uncertainty and likely error to our slope analysis, as it is impossible for us to know the true slope of a smaller area from this data alone.

We did our best to consider all transit stops in the creation of these maps; however, the spatial data for rapid transit stops (SkyTrain stations) was only available for Vancouver proper. As such, we made the assumption that there would be no SkyTrain stations that did not have a bus stop within 417m of it. This is based on our existing understanding of transportation within Vancouver, knowing that bus and SkyTrain transportation routes overlap at most major stations to accommodate comprehensive coverage of the Greater Vancouver Area.

In order to make our analysis feasible, we had to make a number of educated assumptions about the life and mobility of individuals with mobility challenges in Vancouver. Though we relied on accepted guidelines and measurements of electric and manual wheelchair use when possible, the size of our buffer zone for wheelchair users should not be taken to reflect any individual or average mobility. In addition, this report does not take into account the existence of accessible HandyDART ride-share vehicles, personal vehicles, or the accessibility of individual buildings and services, all of which could significantly alter our results.

To best create a visually appealing map that housed all of the necessary data, we opted for the use of a heat map rather than point data. Heat map for services shows only density as opposed to where they actually are. Furthermore, the services that are accounted for in the heat map include all services – not just the ones that have been deemed “accessible”. While inclusion of all services is beneficial because it provides a holistic understanding of service availability around the city, in term of application for someone with mobility issues, this may be misleading. This misrepresentation can be considered an ecological fallacy, as the heat map takes into account an average distribution of the services rather than individual, discrete data points.

The location and frequency of transit stops is crucial to this report and analysis; however, we have deemed areas within a 417m radius of stops accessible, despite the fact that in many suburban areas, there may not be an opportunity to live within such close proximity. This may be due to the presence of parks, large roadways, or because of the zoning of specific areas. It is important to recognize that each of the 417m radiuses indicates on our maps may not include areas suitable for residency for these reasons.

FUTURE RESEARCH & RECOMMENDATIONS

There are many potential factors that could be included in a GIS project to determine the accessibility or most accessible areas of any city. For this report, we have considered three major variables to evaluate the accessibility of Vancouver – slope, access to transportation and density of services. While fig. 3 looks at the rental rates, this was not a primary or initial concern of the project; however, it is unrealistic to conduct a study on accessibility without considering rental rates or housing costs, income, and budgetary constraints that may come with having a disability or mobility challenge.

The difference in rental rates between Vancouver – where there is a high density of services and facilities – and Surrey, where there is a low density of services but access to public transit, is striking. Given the same single income circumstance described above, it makes more sense for someone with mobility challenges to live in Surrey or another suburb to accommodate their presumed budget, access to public transportation, and geographical slope-specific requirements. Despite this justification, our primary research question was designed to illuminate the most accessible areas in Vancouver proper. While Surrey and other surrounding suburbs like Delta are technically deemed accessible, they fall outside of the scope of our primary mapping and analysis area.

The geographical information provided by compiling these datasets could be applicable for housing developers (i.e. those looking to build something like a 50 years+ condominium or housing specifically for individuals with disabilities) or for people looking to move into or within Vancouver to better accommodate their mobility needs. This information could be used by realtors to help their clients assess what areas may be the best fit for them; however, rental rates and income are crucial in ultimately making this decision and therefore should be considered and evaluated more in depth than they have been in this report.

Beyond the further exploration of rental rates and budgetary constraints, there are additional datasets that could make this analysis even more useful and realistic. In addition to the digital elevation model that was used to calculate slope, it would be ideal to have some indication of sidewalk presence and general curb height in specific areas as these also may impede one’s mobility.

CONCLUSION

The report above attempts to assess which neighbourhoods in Vancouver are most “accessible”. This evaluation has been conducted by looking at a series of datasets that help understand the quality of life that an individual with a mobility issue may have with regards to ease of walking or independent transportation like wheelchairs (dependent on slope), access to public transportation (a transit stop within 417m if walking or using electric wheelchair, 129m if using manual wheelchair), and density/variety of educational, health, and cultural facilities in the proximity to transit stops. The evaluation shows that Downtown Vancouver, Strathcona, Yaletown and the region surrounding Olympic Village are most accessible in geographic nature; however, when rental affordability is taken into account, the number of accessible regions are limited to include only the Downtown Eastside and Strathcona in Vancouver proper, highlighting a compromise of accessibility dependent upon geographical and accessibility tradeoffs. In the Greater Vancouver Area, select areas in Delta, Surrey and New Westminster are also considered to be accessible.

WORKS CITED

“Building Access Handbook 2014: Illustrated Commentary on Access Requirements in the 2012 British Columbia Building Code,” British Columbia Office of Housing and Construction Standards. 2014.

“How Fast Are Power Wheelchairs?” Hoveround.com. May 2013. www.hoveround.com/help/learn-more/power-wheelchairs-101/how-fast-can-a-power-chair-go

What is a Physical Disability? – Definition & Types – Video & Lesson Transcript | Study.com.

(n.d.). Retrieved December 01, 2016, from http://study.com/academy/lesson/what-is-a-physical-disability-definition-types-quiz.html

Suite Rental Rates in Vancouver British Columbia | RentBoard.ca. (2016). Retrieved December

01, 2016, from https://www.rentboard.ca/rentals/rental_rates.aspx?locid=1040&psttyid=20

Soneblum, Sharon, Stephen Springle and Richard Lopez. (2012). Manual Wheelchair Use: Bouts of Mobility in Everyday Life. Rehabilitation Engineering and Applied Research. 7 Pages.

Study.com. (2016). http://study.com/

Disability Assistance Rate Table. (2016). Retrieved December 01, 2016, from

http://www2.gov.bc.ca/gov/content/governments/policies-for-government/bcea-policy-and-procedure-manual/bc-employment-and-assistance-rate-tables/disability-assistance-rate-table

DATA SOURCES:

Statistics Canada. 2011. Accessed through Computing in the Humanities And Social Sciences University of Toronto. 2016.

TransLink Transit GIS Data. (n.d.). Retrieved December 1, 2016, from

http://dvn.library.ubc.ca/dvn/dv/ABACUSPD/faces/study/StudyPage.xhtml?globalId=hdl:11272/10254

UBC Geography Department, G:/ Drive database

Vanmap. (2016). Retrieved December 1, 2016, from

http://vanmapp.vancouver.ca/pubvanmap_net/default.aspx

APPENDIX 

Figure 1 – Service Accessibility

figure-1

Figure 2 – Public Transportation Accessibility

figure-2

Figure 3 – Rental Accessibility

figure-3

 Figure 4 – Accessibility of Greater Vancouver for Wheelchair Usersfigure-4

Final Project Experience

Our final project aimed to explore service access in Vancouver for individuals with mobility challenges relying on public transportation. In order to produce this map of physical accessibility, we used distance from public transit (bus and rapid transit) stops in combination with slope information. In identifying physically accessible locations and combining this with service data, our hope was to produce a map that identified suitable areas for future service sites.

In order to achieve this aim, we divided our team based on task. We considered individuals’ strengths, preferences and other commitments in order to assign tasks and establish a feasible time frame. This allowed us to meet in person only a few times over the course of the project, vital as we had differing schedules.

In producing the map, we quickly discovered that the most physically accessible areas with the highest density of services overlapped with areas typically associated with higher housing costs. This correlation between physical accessibility and economic inaccessibility forced us to broaden our understanding of accessibility, problematizing our previously defined ‘accessible’ zones. Instead, by considering housing prices as a very coarse indicator of economic accessibility, the most accessible locations shifted out of the downtown core, highlighting the implications of the assumptions and definitions made in GIS. As a result, rather than Yaletown being the most accessible location, the optimal are outside of the downtown core.

Using housing prices required normalization of the data by number of rooms, without normalization the cheapest area was the center of downtown. After normalization downtown became the least economically accessible location. Adding to this, we also classified layers based on a scale of 1-3, enabling us to create a new field and a weighted overlay to produce a single image of Vancouver’s accessibility, producing a sort of very loose and limited ‘accessibility index.’

However, data and time constraints continue to limit the scope of our accessibility analysis, such as information on many service locations data being limited to the City of Vancouver. Furthermore, it was not possible to validate our findings and compare these to reality as we lacked residential information specifically for those with mobility challenges.

Producing this single, weighted map required constant communication with the team, communicating information on findings, process and questions of classification to team members working on separate aspects of the project. This communication was eased by the clear definition of roles and timeframes and by keeping a running document of the steps and methodology used with a section detailing necessary future actions below.

Individual Professional Development Reflection on the Course

By working through the five GIS labs individually and the final project in a team, I was able to explore the spatialization of quantitative data by bringing together theoretical concepts and technological skills in order to see the divided spaces of variation and overlapping phenomena. But more than this abstract appreciation for space through ArcMap, I was able to see the tangible implications and uses of geography. Specifically, exploring the environmentally sensitive areas with the Garibaldi at Squamish project area highlighted the importance of understanding space to reduce harm and maximize benefit, slowly moving my understanding of what it means to be a “Geographer” from classroom to practice.

Skills, Accomplishments and Reflections on Labs

Throughout the course GEOB270 (Introduction to Geographic Information Systems), I had the opportunity to develop key GIS skills in ArcMap by completing five labs and a final project. Below, I outline a few of these skills.

In Lab One, I developed an Understanding of ArcMap’s on- and off-line basic functions in order to begin adding data, creating maps, and preparing to analyze both spatial and attribute information, vital steps for producing spatial knowledge from information.

In Lab Two, I handled the improper referencing of spatial data and adjusted the projected coordinate systems of a layer to create a digital map of Canada ready for data analysis.

In Lab Three, I worked with the select by location, clip and intersect tools to extract data on land uses vulnerable to tsunamis in Vancouver, producing a map useful when zoning for tsunami risk and planning for the city’s sustainable future.

In Lab Four, I normalized data in order to map housing affordability in Vancouver and Ottawa, allowing me to explore the impact of normalizing by income and understand the importance of considering the impact of many interconnected variable on urban accessibility.

In Lab Five, I applied my learning to solve a tangible problem, performing an environmental impact assessment of the Garibaldi at Squamish project to develop strategies for harm mitigation while preserving the economic opportunities the project offers.


Lab 5: Environmental Impact Assessment: Garibaldi at Squamish

Protected Areas in Project Area
Hill shade map of the Old Growth Management Areas and Winter Ungulate Ranges within the proposed Garibaldi at Squamish project area

Memo from an Environmental Assessor:

This memo accompanies a series of maps and will discuss their context, my role within the project, the results of the maps and my overall recommendation for the project going forwards. Through outlining the steps of analysis and the resulting information, this memo will highlight that redlisted ecosystems and the boundaries around fish-bearing rivers are the greatest environmental concerns for the project’s implementation.

What is the Proposed Project and Who am I?:

This series of map comes as a response to the BC Environmental Assessment Office’s statement in 2010 that the Garibaldi at Squamish project proposal lacked information on the potential effects of vegetation, fish, and wildlife habitat. These maps visually and spatially supplement the additional documents, which were submitted in April 2015, and may be used in ongoing discussions after the proposal’s tentative approval in January this year to show the extent of developable land. Specifically, as a Natural Resource Planner for Northland Properties and Aquilini Investment Group of Vancouver – the Garibaldi at Squamish project proponents – I intend these maps to be assist in the evaluation of the project’s priorities in order to proceed with the proposed year-round resort.

Method:

I combined spatial data from multiple sources in order to identify the total area impacted by environmental protections. I sought data for each concern item of missing information identified by the Environmental Office in 2010, compiling data on red-listed species’ habitats, old growth forest management areas, ecosystems (including biogeoclimatic, nutrient regime and soil moisture conditions), rivers, roads and elevation. Working with this data in combination with files delineating the scope of existing parks and the project’s proposed boundary, I created a single database and adjusted each layer so that is was referenced in a common 2D map projection form (in this case the Universal Transverse Mercator projection, Zone 10). The resulting compilation showed a map of all relevant environmental and topographical conditions within the proposed area boundary.

In order to identify the zones of concern, I first worked with the elevation model to identify areas below a suitable threshold for skiing, i.e. the area below 600m in elevation.

Adding to this constraint by considering the four dimensions of the local ecosystem’s fragility, I firstly dealt with the area of old growth forest that is under management, calculating the percentage of area that is covered in the project. Secondly, I used ungulate habitat data to map the sensitive areas of two species impacted by the project: Mule Deer and Mountain Goats. Thirdly, I used terrestrial ecosystem mapping data to identify the endangered, red-listed species’ habitats located within the project’s bounds. Biogeoclimatic, soil moisture and nutrient regime conditions indicate the existence of six redlisted species to be considered within the area: Falsebox, Salal, Cladina, Kinnikinnick, Flat Moss and Cat’s-tail Moss. These species were identified by finding areas that contained all of the necessary conditions for the most common red-listed ecosystems in the area.

Finally, I considered fish and fish-bearing streams in line with the BC Environmental Office statement. Streams above 600m are considered less likely to be fish bearing and, therefore, I considered their surrounding riparian area of concern to be smaller, only 50m. I created concern zones of 50m around rivers flowing above 600m. Below this elevation, the surrounding area of concern was extended to 100m with the greater likelihood of these streams being home to fish. By totaling the areas of these river protection zones, the total percentage of effected area of identified.

Results:

  • Old growth forest: 3,710,332m2, representing 6.78% of the total area.
  • Ungulate Winter Range: Mule Deer habitat covers 2,317,859.14m2 and Mountain Goat habitat accounts for 1,997,299.79m2, representing 4.24% and 3.65% of the proposed project area respectively. In total their habitats cover 7.87% of the proposed project area, or 4315158.93m2.
  • Red Listed Ecosystems: in total redlisted habitats cover 13,584,529.76m2, or 24.84% of the proposed project area
  • Fish protection: 15,555,960.43m2 of the land is effected by fish bearing stream protection areas, representing 28.43% of the project area
  • Below 600m: The area of land below 600m is 17,394,027.82m2, representing 31.79% of the proposed site.

However, by merely totally these areas of ecological concern, a full 67.92% of the project area would be deemed of concern. Instead, by spatializing the zones, it is evident that many of these areas overlap, reducing the overall coverage of protected areas to a more reasonable 53.70%. When considering both the areas of ecological concern and the land below 600m elevation that is likely to be unsuitable for reliable skiing, the total area of concern is 32,630,898.44m2, or 59.64% of the total proposed area.

Two Greatest Environmental Concerns:

Breaking this total area of concern down by category, the two greatest environmental concerns affecting the project are fish habitat protection and the elevation of reliable skiing. The two areas represent the largest percentages of area. However, this project is intended to be a year round resort, meaning that the elevation of reliable skiing is not as important. Instead, the two greatest areas of concern are fish habit (28.43% of the total area) and red-listed ecosystems (24.84% of the project area). The river network in particular extends well beyond the suitable skiing elevation of 600m, impacting both summer and winter activity. The red-listed areas are largely concentrated below 700m in elevation and covering a lot of the land at this lower elevation, greatly impacting summer activity.

Ways to Mitigate Concerns:

These two concerns can be overcome through careful planning. To overcome these two concerns, and remembering the challenge of skiing below 600m elevation in the winter, I would recommend concentrating development on the land over 700m in elevation, beyond the extent of flat moss habitat. This will help to abate environmentalists concerns and increase resort profitability as services can be centralized in the least fragmented area. Secondly, in order to mitigate concerns from environmentalists, I would recommend creating a few major and well-signposted routes up to this higher elevation as customers and construction crews need easy access to higher elevations. The process of trail design through the low elevation area would benefit from engaging community consultation in order to continuing dispelling environmentalists fears and help in mitigating further social and heritage concerns.

Memo Reflection: My Own Ethical Stance

Although my memo suggested an acceptance of the proposal with only a few modifications, my personal reservations about the site are greater. I think a more holistic approach is needed to consider the impacts of the project beyond definable environmental zones, taking into consideration the pollution of operation, the emissions from transportation to the location and the environmental costs of construction. I also emphasize the need to consider impacts on First Nations communities – especially as the Squamish First Nation considers the mountain sacred – and the Squamish community – who have protected the development.

Yet, the project promises 2000 construction jobs, 4000 operating jobs and $49 million in tax revenue (Zeidler, CBC.ca, Jan 2016) and I do recognize the possibilities for the project to make as positive contribution. As the Squamish First Nation chief, Ian Campbell, highlights, the project has the ability to correct some of the past status quo with community involvement. For example, beyond the recommendation I make in my memo, the project could dramatically scale down its operations, it could explore environmentally-sensitive construction practices, or it could work with transportation authorities to reduce its emission externalities.

By making adjustments on this larger scale, I would be more likely to support the proposal as it addresses the preservation of economic stability, environmental quality and the existent Squamish community.

Lab 4: Ethical Implications of Quantitative Data Classification and Housing Affordability

Choice and the Ethical Implications of Quantitative Data Classification

The following four maps all display the same data; they show the spatial variation of housing prices in Vancouver. But they use different classification methods, producing very different views of Vancouver.

Impact of data classification for housing prices in Vancouver

These maps show the impact of classification schemes on how we understand Vancouver’s situation, highlighting the ethical implications of classification and map making. By choosing the classification system, different features are highlighted and trends are distorted, meaning that different interpretations are made and different messages are conveyed.

Take, for example, a comparison between the equal interval and standard deviation classification methods shown above. Using the equal interval method, a rather homogenous picture of Vancouver is created with just a few spots of very high housing prices that would not be accessible to lower income earners. In contrast, the opposing colors of the Standard Deviation classification system underscore the disparity within Vancouver, emphasizing the gap between high and low home values from West to East. By working from an average with a diverging color scheme as the standard deviation approach does, the gap is intensified to highlight polarization and suggest increasing inequality.

This example highlights the social and political implications that are associated with classification systems, sparking ethical debates about the accurate portrayal of Vancouver’s housing markets. The portrayal leads to calls for different (in)action in response, giving the map maker a lot of power of the portrayal of Vancouver. By extension, the map maker has an ethical responsibility to produce a map that is not only accurate but also sensitive to its interpretations, but the reader must know the purpose for which the map was produced as this often sways the classification system used and the data’s representation.

For example, the reader of a newspaper must be aware of the journalist’s desire to produce a visually appealing and dramatic map to encourage people to read the associated article. As a result, a journalist is likely to choose to use the natural breaks method for classifying data on Vancouver’s housing prices for three key reasons. First, natural breaks method is an approach most would understand, as most similar values are grouped together by color. Secondly, without too much of a background in maps, the natural breaks method is intuitive to understand (i.e. the darker colors represent higher costs). This contrasts to the methods of standard deviations where a more mathematical and statistical background are needed to understand the process of classification and the divergent color scheme. Thirdly, the map draws attention to the uneven clustering of wealth in Vancouver, good for a making a provocative point about inequality and disparity in Vancouver.

In contrast, the equal breaks map, and to a lesser extent the manually classified view, might be used by a real estate agent preparing a presentation for prospective home buyers near UBC and has an invested interest in making Vancouver seem both affordable and a good investment. Therefore, a real estate agent may use equal interval classification because it makes UBC itself look affordable and gives the impression that Vancouver as a whole is quite affordable, with just a few areas of high house prices. These areas of high prices highlight, not far from UBC, the potential for a growth in housing prices in Vancouver, deeming Vancouver to be a good city for real estate investment.

As a consequence, map classification systems are vital to understand for the production of maps, but also for their readers who may be swayed by their purposeful representation of the data.

Housing Affordability in Vancouver and Ottawa 

A comparison of Housing Affordability in Vancouver and Ottawa using a common legend

The above map compares housing affordability between Vancouver and Ottawa, underscoring the dramatic difference in affordability between the two cities. But what does “affordability” really measure? Why do we use this indicator instead of raw housing prices?

Affordability is calculated by dividing average housing prices by income for a given location. This ratio results in a value indicating not only the price of housing but how much of an individual’s income is likely to have to be spent on their housing. For many cities, when families and individuals have to spend more than 30% of their income on housing, it is deemed unaffordable. The “Demographia International Housing Affordability Survey: 2016” defines unaffordability as a ratio of housing price to income greater than 3. This is a more useful measurement than merely assessing housing prices because both housing prices and the incomes people receive to pay for their housing vary spatially. For example, house prices in city X may be high but so too may incomes in city X, meaning that the housing prices for people in this city do not pose a challenge or degrade disposable income. In contrast, when income is low but housing costs are high, people may be forced to spend huge percentages of their income on housing, leaving little for necessary goods (e.g. food, clothes), vital services (e.g. health care), or consumer spending that stimulates a local economy. Therefore, we often use affordability as a measure as opposed to raw values as it accounts for the changes in multiple variable across space, enabling a more accurate understanding of the likelihood of families and individuals facing challenges.

As mentioned above, an affordability value of 3 is often used as a cut off for affordability, but unaffordability is further broken down into degrees of unaffordability. See the table below for the classification break down of the affordability index.

Descriptive Rating Affordability Index Median Multiple
Affordable <3.0
Moderately Unaffordable 3.1-4.0
Seriously Unaffordable 4.1-5.0
Severely Unaffordable >5.1


The cut off for housing affordability comes from a history of the median multiple being generally between 2.0 and 3.0 for major cities in Australia, Canada, Ireland, New Zealand, the UK and the US until the late 1980s, according to Demographia.  The value of 3.0 was also used by Arthur C. Grimes, a former chief economist of the reserve bank of New Zealand.

This seemingly fluid and approximate basis for the use of the 3.0 cut off does not breed confidence in this cut of being a particularly meaningful cut off for today, especially as the new norm for large metropolises is to be well above this 3.0 level. In fact, by Demographia’s own publication, the most affordable major market, the United States, still has a median multiple of 3.7, placing it firmly within the “moderately unaffordable” bracket. In contrast, Hong Kong’s rating is 19.0 more than triple the score for “severely unaffordable.” The wide diversity within this top bracket of “severely unaffordable,” ranging from Australia at 6.4 to Hong Kong at 19.0, suggests that the need for another bracket that does homogenize these markets and miss their dramatic differences.

This argument for another class, and the possible amalgamation of lower classes that are no longer as meaningful divisions with the growth in affordability disparity, highlights that the current classes are outdated. This outdating arises as the data breaks are subjective and arbitrary, reliant on historical trends rather than on individual’s needs (e.g. with a ratio of greater than X it becomes impossible for people to purchase high quality food, with a ratio of Y purchasing even basic sustenance is a challenge etc.).

As a result, this classification scheme is not useful for comparing the affordability of large, globalized markets which all fall with the top bracket, nor is the classification very trust worthy as it is not related to a specific value or cost, or to the distribution of affordability values globally, failing to take into consideration the full range of the data.

But, is affordability a good indicator for “liveability?”

It must be remembered that livability is a very broad term, encompassing variables such as sustainability, walkability, safety and diversity. It also considered food affordability, clothing, water supply and other basic needs beyond housing. These variables are not all accounted for in narrower discussions of housing affordability.

However, bearing in mind the narrow dimensions of affordability and the issues associated with trusting the affordability indicator as a classification system, I still argue that it is a useful indicator for assessing a city’s livability. The indicator provides a basis and framework for assessing people’s access the basic necessity of housing, as well as to vital goods and services beyond housing with their remaining income. The indicator is able to incorporate two variables to contextualize housing prices in place and link them to individuals’ needs through underscoring the median percentage of a population’s income spent of housing. In general, it is apparent that affordable places are likely to be more livable and places with greater unaffordability will be less livable.

Lab 3: Tsunami Danger in Vancouver

Percentage in Danger:

Landuses in danger of being being effected by a tsunami in Vancouver

From this map, it is possible to see that 15.5% of Vancouver is at risk of a Tsunami. This figure comes from comparing the area in danger of a tsunami with the total area of the city. The places in danger from a tsunami are defined as areas that are 15 meters or less above sea level and within 1km of the coast. By mapping both this danger zone over a background map of Vancouver, it is possible to visually assess the proportion of Vancouver in danger. To mathematically calculate the percentage at risk requires identifying the total area in danger:

  • right click on layer > attribute table > highlight area column > right click > summarize > note “sum” value)
  • divide this by the total area of Vancouver (using the same method for identifying the total area as before)
  • Multiplying the result by 100.

Simplified visual depiction of process:

making-danger-zone
Simplified model of identifying percentage of Vancouver at risk from a tsunami

Within this danger zone, there are 10 educational and 5 health care facilities at risk:

Health Care Facilities at Risk:

  • False Creek Residence
  • Villa Cathay Care Home
  • Coast West Community Home
  • Broadway Pentecostal Lodge
  • Yaletown House Society

Educational Facilities at Risk:

  • Emily Carr Institute of Art and Design (ECIAD)
  • Institute of Indigenous Government (IIG)
  • Henry Hudson Elementary
  • False Creek Elementary
  • St Francis Xavier
  • Vancouver Montessori School
  • St John’s International
  • Heritage 3R’s School
  • St Anthony of Padua
  • Ecole Rose Des Vents

These facilities were identified by adding all of the health care and educational facilities to the map of Vancouver and then selecting only those facilities falling within the previously defined tsunami danger zone before generating a table to read the names of endangered facilities from.

Select all of the facilities in the danger zone and create a new layer. A layer is a slice of the information from the map, selected based on a common theme – e.g. a layer showing schools. Each of the new layers displays only facilities within the danger zone.

  • Clip the education and health facility layers to the danger zone area using the clip tool from within ArcToolBox
  • Two layers are produced, one of the endangered health facilities and the other of the endangered educational facilities
health-and-edu-danger
Map of Endangered Health and Education Facilities in Vancouver

Open the attribute tables of these endangered layer and the names of the facilities can be read off in turn

attribute-table-of-endangered-1
Attribute Table of Facility Names

Simplified visual depiction of process below:

Simplified depiction of health and education facility identification

Lab 2: Map Distortion, Projection and Advantages of Landsat

Map Distortion and Projection

When creating a map in GIS it is possible that the data in the individual layers (a set of data with a common theme) will have been downloaded in different projection systems. Projections are the ways in which a 3D globe is transformed onto the 2D page. The result is always that distortion occurs as it is impossible to perfectly flatten a spheroid. Distortion of area, angle, direction and distance can occur and cartographers must choose which aspect of distortion to accept in order to preserve other aspects (e.g. distort angle, direction and distance in order to preserve area) (see Mercator Projection below).

Preserves angles to help in navigation but dramatically distorts area. For example, on the map Greenland looks the same size as Africa but in reality is about 13.7 times larger than Greenland. This is because Africa is much closer to the equator where the Mercator projection is better as preserving area than Greenland whose area is dramatically exaggerated.
Mercator Projection: Preserves angles to help in navigation but dramatically distorts area. For example, on the map Greenland looks the same size as Africa but in reality is about 13.7 times larger than Greenland. This is because Africa is much closer to the equator where the Mercator projection is better as preserving area than Greenland whose area is dramatically exaggerated.

The result of using different projection systems is that when layers that are projected differently are combined their common features do not align (e.g. the same stream is depicted in two locations). But, ArcMap is able to counter act this challenge with a feature called “project-on-the-fly,” in which features in different projections are temporarily aligned so that they visually correspond (i.e. the stream in two layers would be depicted in the same location).

ArcMap can only project-on-the-fly if the layer is properly referenced, meaning that data about the projection system used is attached to the layer. But, when viewing some layers, their coordinate systems may be described as “unknown.” “Unknown” means that ArcMap does not know the distortion properties and, therefore, cannot align the information in a common projection.

You will know that a layer is not properly referenced if, when you add it to the map, a warning states “unknown spatial reference” and visually the layer’s size, location or shape is different from the existing layers. Alternatively, when viewing the spatial information in ArcCatalog, the current coordinate system is defined as “<unknown>.”

The steps below describe the process of finding improperly referenced data, referencing the data and adding the layers to the map so that features visually align.

Part 1: Review the Spatial Data Properties:

First, you will need to examine the data in ArcCatalog:

  • Open Arc Catalog from the start menu
  • Create Folder Connection to Data:
    • File > Connect to folder > select folder > Okay
    • Make sure the catalog tree (the list of information on the main screen) now lists the data you want

Click on each of the layers in turn and view their contents, preview and description by selecting the tabs along the top in turn. The preview will show a map and the description tab will provide some of the meta data from the map, including information about collection and data quality. Read this meta data, paying attention to the coordinate system and extents of the data. Return to the catalogue.

Right click on each of the layers in turn, selecting “properties.” Under the “XY Coordinate System” tab there is a box entitled “Current coordinate system,” this box shows the spatial information of the data. Review the spatial data properties here.

  • Note the datum, coordinate system and units used in the shape files. The coordinate system may be a projected coordinate system using meters/kilometers/miles or a geographic coordinate system using decimal degrees

Within the “current coordinate system” box, one or more layers may state “Unknown,” indicating that there is improperly referenced data. Make a note of this layer.

Part 2: Referencing a Layer:

Now, close arc catalogue and open Arcmap from the start menu. From Arcmap it is possible to edit the layers, change their overlay order and fix their spatial references.

When Arcmap opens a dialogue box is opened. Select “templates” from the list on the left and double click on “Blank map.” Arcmap opens with no information displayed.

Launch ArcCatalog from within ArcMap: Windows > Catalog.

Pin the catalogue to the right hand side of the window by dragging the catalog and dropping in to the right. To pin the catalogue, click the push pin symbol on the top right so that it is facing downwards.

In the catalog, find any layers that were not displaying their spatial information correctly in Arc Catalog and right click. Select properties > XY Coordinate system tab. The coordinate system will be listed as “unknown.”

View the box above and navigate to the original coordinate system of the data (selecting a geographic or projected coordinate system, the area you are working within etc.). Click ‘Okay’. Repeat this process for any other layers with improperly referenced data.

Your layers should now be properly referenced with defined coordinate systems.

Now you will need to add your layers to the map’s table of contents to project them all. Find all of the layers you wish to add to the map and drag each in turn to the left hand side of your screen, into the table of contents. You can move the layers within the Table of Contents by dragging and dropping so that all of the data can be seen.  The layer closest to the top of your screen will display above all of those below it.

Your layers should now overlay each other and match up, visually aligning due to ArcMap’s “project-on-the-fly” function. But, the project-on-the-fly display does not fundamentally change the projection of the data, it merely aligns common features. Before performing an analysis, you need to change the coordinate systems to a common one, requiring the use of the “Project” tool.

Part 3: Re-Projecting a Layer:

Decide on a common projection system you wish to use, considering the longitudinal extent of your area, its shape and its location.

Open ArcToolbox from the tool toolbar. Move the appearing window to the right hand side of the screen and dock it here. In the toolbox, navigate to Data Management Tools > Projections and Transformations > Project.

In the window that appears type the location and name of the layer you are trying to alter into the “input dataset” box. The output dataset should automatically be filled and the output coordinate system is a projected coordinate system found by navigating to the icon on the right hand side. In the window that appears, select the coordinate system you wish to use. In the case of Canada this is likely the Canada Lambert Conformal Conic for viewing purposes. This projection can found within continental > North America. However, other projections, preserving different qualities may be better suited to other purposes. The “project” dialogue box should resemble the one below:

Press “Okay” and wait for a new layer to be created. This is a new set of data. View the properties window > source. Note the top, bottom, right, left extents and their units. Compare this to the previous layer’s source information. The previous layer can be removed from the table of contents by right click > remove. Repeat this process of modifying the layers into a projected coordinate system for each layer in turn, enabling future data analysis

The map is now ready for analytical use.

Remotely Sensed Landsat Data: 

Can you see change over time in your map? Were you able to find data about the whole globe? Is your map clear to interpret? If not, Landsat imagery may be the solution.

Landsat is a NASA program that is based on satellite imaging. Landsat images cover the whole earth and have been recorded every 16 days since 1972. Landsat satellites are able to take multispectral images, meaning that they are able to show how the world looks in different wavelengths across the electromagnetic spectrum, including wavelengths visible to our eyes (e.g. red, blue, green) and those not visible (e.g. Infrared).

This ability to switch between different wavelengths when viewing Landsat images is a key strength as it enables different features to be identified clearly based on the frequency of reflected light. As a result of using specifically defined wavelength bands, Landsat is able to provide information on land use change, vegetation change, hydrological patterns, urban growth, and more. For example, the Landsat imagery of before and after the Mount St. Helens eruption clearly shows the change in hydrology, vegetation and landform (See Figure Below). Understanding changes and the existing landscape enables people to perform environmental monitoring, track resources and identify future risks to populations (e.x. heighted potential of flooding).

But, more than its ability to filter across the electromagnetic spectrum, Landsat holds three other advantages. Firstly, Landsat images cover the globe, meaning that patterns and trends can be broadly assessed. Secondly, these images are now available for free, making them widely accessible. Lastly, Landsat images have been recorded since 1972, meaning that there is a very long duration of data recorded and slow, longitudinal changes can be observed.

These advantages can be clearly seen in Mount Saint Helens images below build from Landsat Data. They clearly show vegetation and topographical change as a result of the volcano’s eruption.

landsat
Using Landsat data to assess vegetation and landscape change at Mount Saint Helens


Trail Six, An Undergraduate Journal of Geography

Over the past two years, I have loved being involved with this journal both as an editor and a contributing author. The quality of work and the dedication the team shows is just astounding and engaging in this journal has broadened my understanding of not only my narrower area of human but of the whole department.

As an editor, I had the opportunity to read snippets of wonderful work my peers have been producing, while being on the other end as an author really gave me space to delve deeply into one area, exploring more of the intricacies of social housing in Vancouver. Along with a team of fellow student researchers, we initiated a research project to explore the social dimensions of housing. Time and again, interview participants from non-profit groups across the lower mainland reiterated the importance of relationships for increasing stability. From these interviews, an observational study and from in-person survey data, we were able to codify the “Relationship First” model (see diagram below), which enabled us to call for a shift in how social housing is studied in Vancouver. We argue that social housing must be considered within an expansive frame, taking into account the relative positionalities of all Vancouver’s residence, which impact the creation of a mutually inclusive community.

t6
Relationship First Conceptual Diagram

Overall, being a part of this journal has given m the opportunity to both explore the discipline of Geography as I try to make it my own and develop vital critical thinking skills, whilst emphasizing the power of writing as a tool for knowledge creation and social change.

To learn more about the Trail Six journal click here.

Undergraduate Journal of Political Studies, UBC

Working to publish an article with the UBC Undergraduate Journal of Political Studies was both a challenging and rewarding task, teaching me skills such as strong writing and editing skills through four rounds of proofreading. These skills enabled me to communicate the findings of my research into the results of privatizing environmental regulation to voluntary certification mechanisms, such as the Forestry Stewardship Council. I was able to concisely assert that this new governance system perpetuates global inequality and, in so doing, raise awareness for the counteractive global gap produced in a period of globalization. Learn more about the journal here.

SONY DSC
The forests of North Vancouver from Grouse Mountain

Spam prevention powered by Akismet