Lab 2 – Coordinate Systems and Spatial Data Models
In this lab, ArcGIS was used to explore spatial map data of Canada and Washington State (US), in order to become more knowledgeable about coordinate systems, datums, projections, and spatial data models.
See the bottom of this post for images, or click here for image 1 and image 2.
Accomplishment Statement:
Throughout this lab, I learned how to manage and preview data in both ArcMap and ArcCatalog, gained knowledge about coordinate systems and projections, compared different spatial data models and their characteristics, and received a basic understanding about how remote sensing functions.
This lab did not require the production of a final cohesive map, however I did save a series of images that show the results of this investigation, as shown below.
Reflection Questions:
How to fix misaligned and improperly referenced spatial data?
Sometimes spatial data can be misaligned or improperly referenced, and this can result in many issues and incorrect differences between multiple layers. The following steps are ways to fix this spatial data problem.
Firstly, the layers can be checked in the ArcCatalog program. Navigating to Properties then XY Coordinate System will provide information about the spatial data. There will either be missing information (“unknown”) or information about what type of coordinate reference system and datum is used for each layer. All this information should be noted.
Layers can now be added to the Table of Contents. If there is no spatial data, then a warning message will appear. To realign these layers you can fill in the missing information. Return to the same Properties and XY Coordinate System tab as before, and select the appropriate coordinate system that you would like to use. Now this layer can be added into the Table of Contents without issue.
If a layer is going to be projected for specific analysis, it can be projected with a different coordinate on the same coordinate system as other layers. Data can be modified by navigating to ArcToolbox then to Data Management Tools
and then to Projections and Transformations, and under Project. Here the Output Coordinate System and Output Dataset can be edited, in order to align with the coordinate system of the other layers. This can then be added as a new layer.
What are the advantages to using remotely sensed Landsat data for geographical analysis?
The Landsat Program is a remote sensing program. Landsat has been used since 1872, producing raster data that shows the world in images at approximately 16 day intervals.
The information that the Landsat collects can be very useful in geographical analysis, since it allows for observation
of changes in the surface of the earth over time. It additionally can portray levels of energy that are not visible to the naked eye due to their wavelength. In this lab, we used Landsat data to observe effects that the 1980 Mt. St. Helen’s eruption had on the surrounding landscape.
Images:
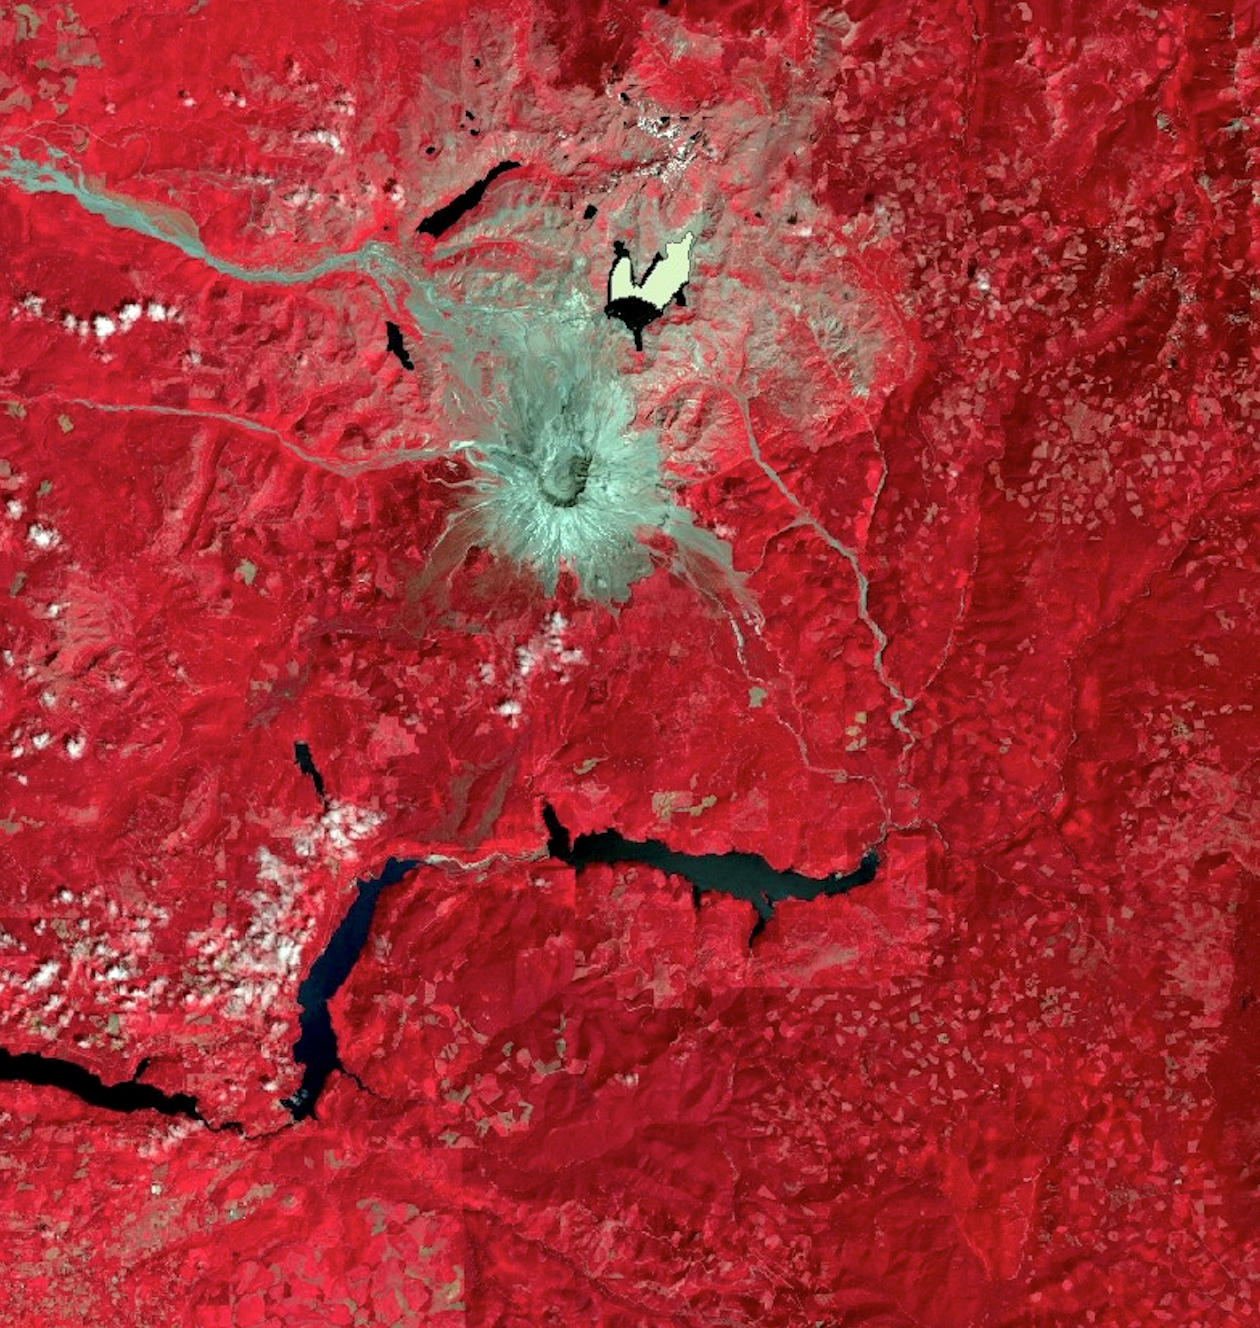
Image 1: Mt St Helen’s eruption infrared bands
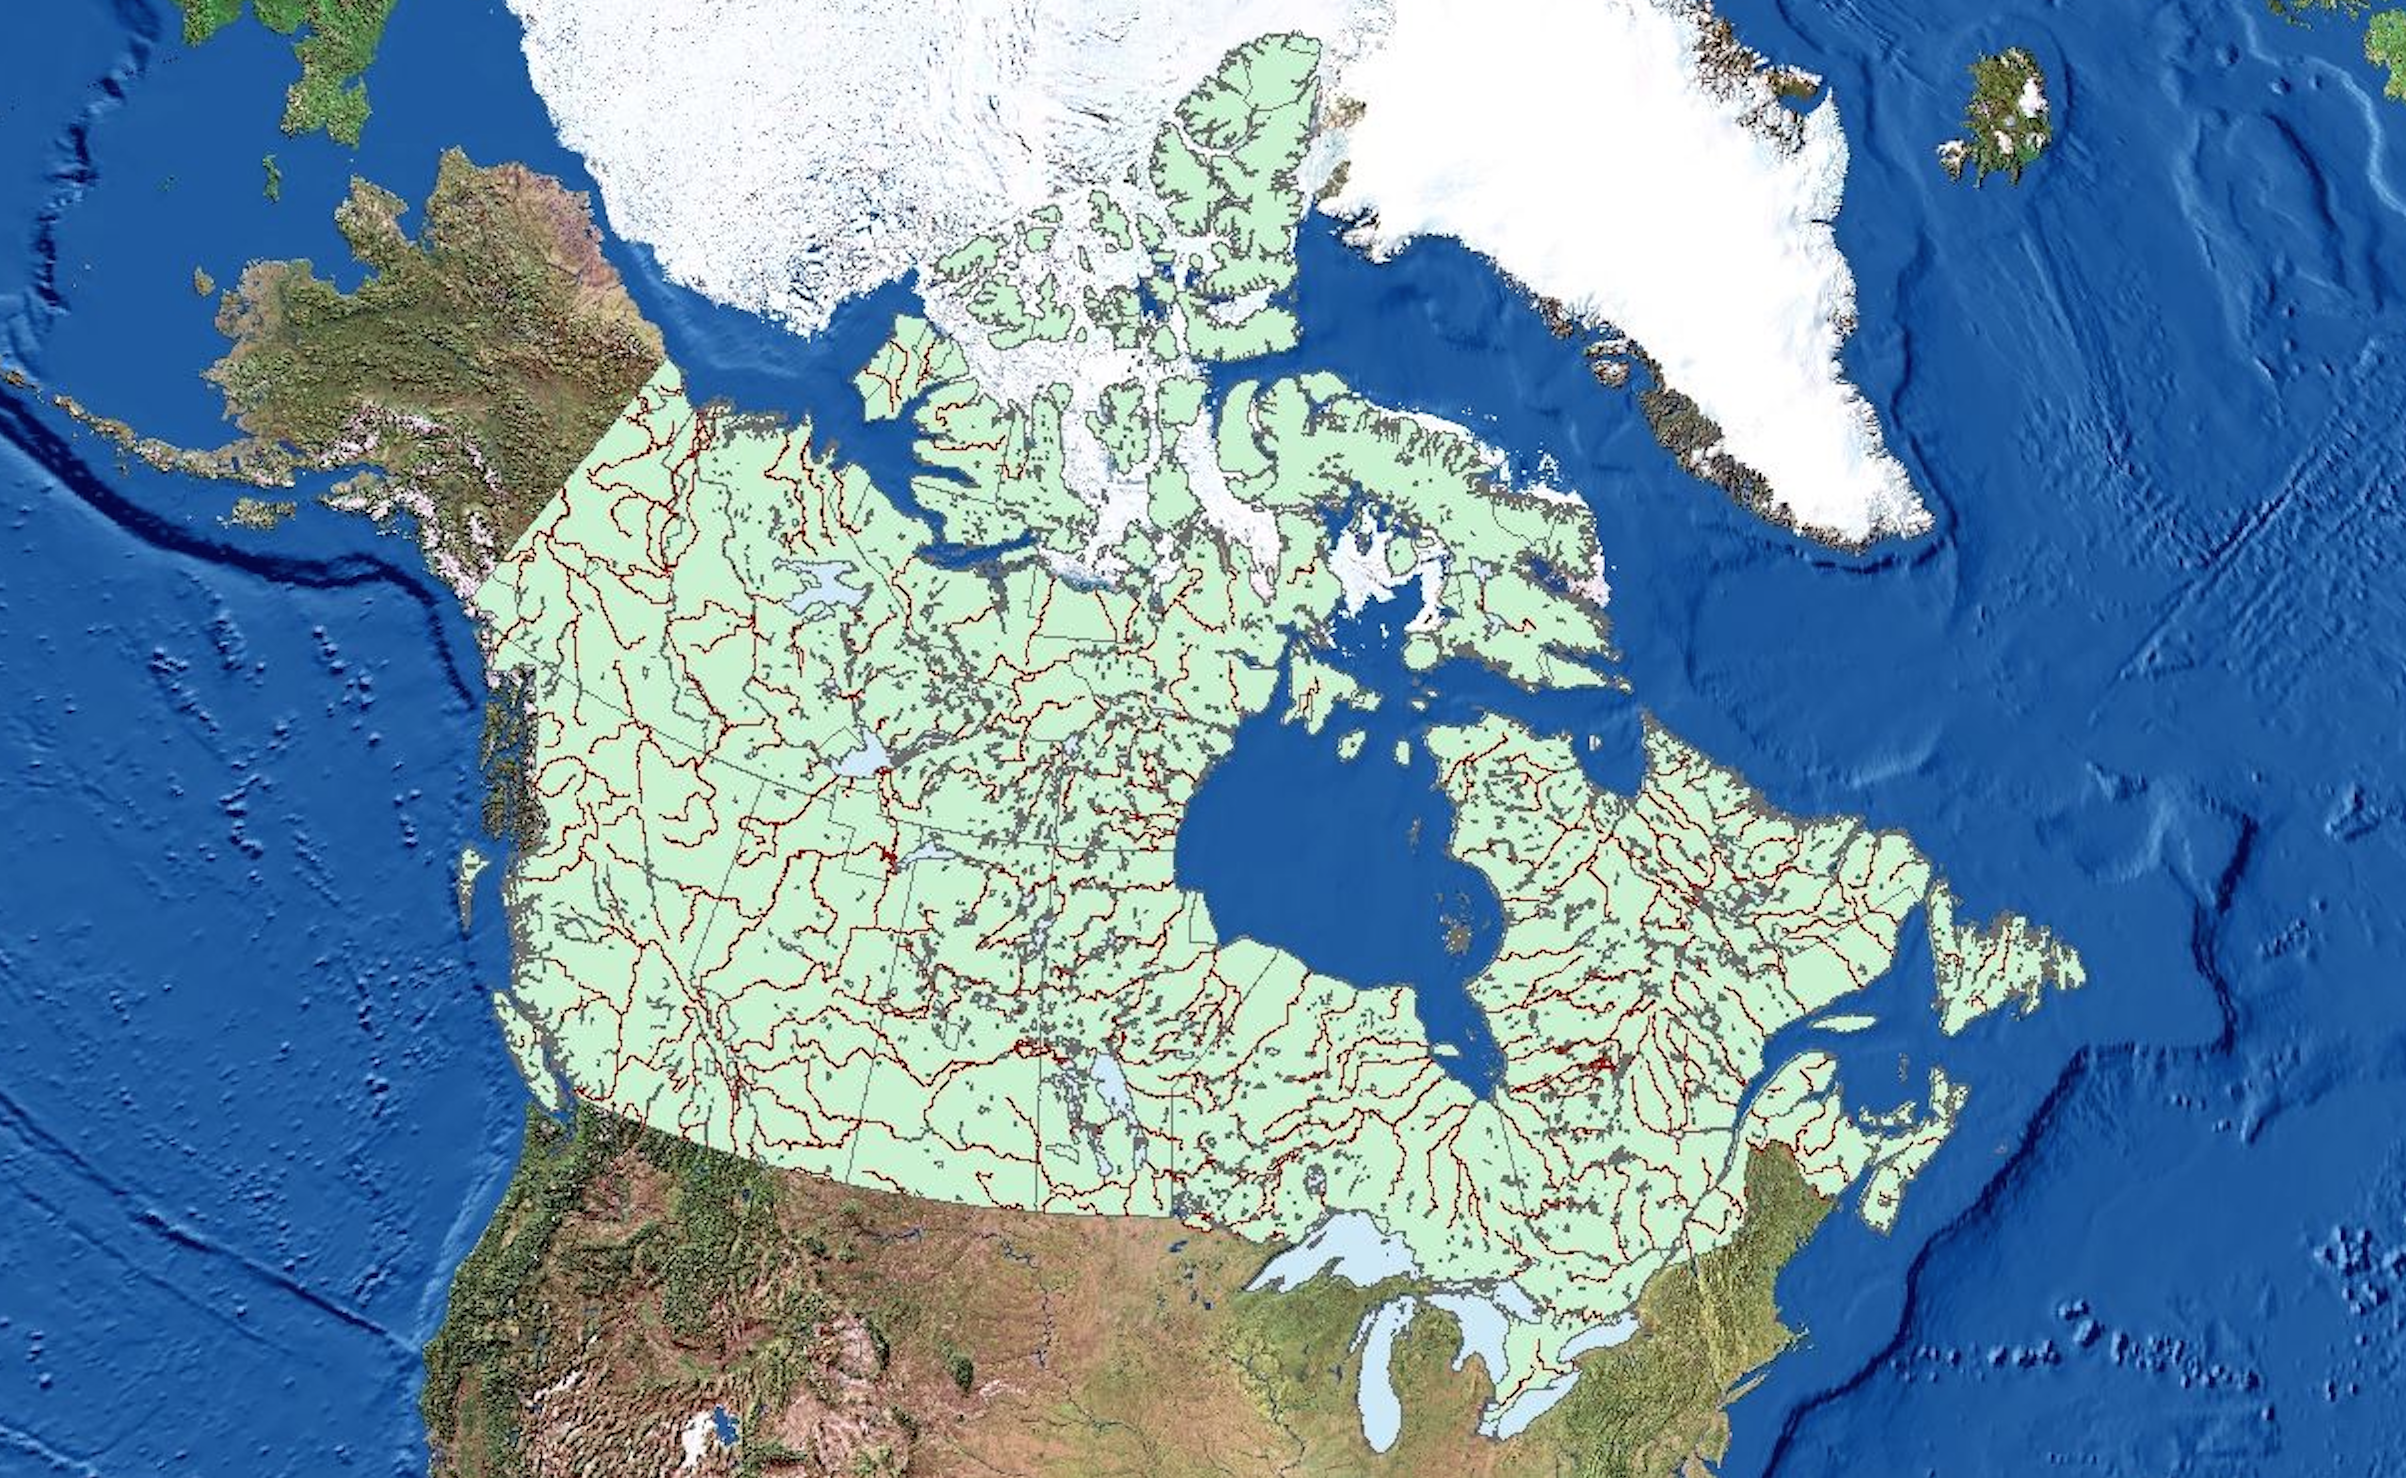
Image 2: Map of Canada