Lab 4 – Housing Affordability
In lab 4, the task consisted of created maps for Vancouver and Ottawa on housing cost and housing affordability, as if they were for an article in the Globe and Mail.
See the maps at the bottom of this post, or click here for housing cost in Vancouver and Ottawa, here for affordability in Vancouver and Ottawa, and here for comparison of different data classification methods in Vancouver
Accomplishment Statement:
For this lab, we were not provided with readily available data on GetData, and instead had to access and download data from the Abacus Dataverse Network. I gained an understanding of how to search for and obtain data from an external source, which I imagine will be very helpful in future GIS projects.
Reflection Questions:
Since you are a journalist, putting together maps of housing cost in Vancouver, which classification method would you choose for your audience and why? What if you are a real estate agent preparing a presentation for prospective home buyers near UBC? Are there ethical implications for your choice of classification method?
As a journalist, I would choose to use the Manual Breaks classification. I will assume that my audience is people who are interested in the unaffordability of housing in their city, and in Vancouver this is a wide range of people in the general public. Therefore, I cannot expect them to know how to interpret some types of maps, such as the standard deviation. The Manual Breaks classification allows me to set class ranges and class breaks to present my data, and shows which areas of Vancouver are unaffordable in an easy-to-read format. This choice of classification method may have ethical concerns, in that I am able to manipulate the data in order to exaggerate the unaffordability in Vancouver.
As a real estate agent aiming to encourage people to buy homes near UBC, I would want to make this region look as affordable as possible. I would therefore choose the Equal Interval classification method. This method presents the UBC / Point Grey area as relatively affordable, whereas with the other classification methods, these areas are portrayed as more expensive relatively. Seeing that the UBC / Point Grey area is more affordable than neighboring areas or other parts of Vancouver, prospective buyers would likely be very interested in purchasing a home in the cheaper areas. Ethical concerns for using this method are from not showing the deviation UBC / Point Grey has from the standard, which could be misleading to buyers and shock them when they find out what the real cost of these properties is.
What is affordability measuring and why is it a better indicator of housing affordability than housing cost alone?
Affordability normalizes housing cost by taking into account that people living in larger cities tend to have higher incomes in comparison to people living in smaller cities. Therefore, it is a better indicator of housing affordability than just using housing cost since it essentially creates ‘an even playing field’ for comparison. See maps below for a comparison of housing affordability in Vancouver and Ottawa.
What are the housing affordability rating categories? Who determined them and are they to be ‘trusted’?
The housing affordability rating categories are created using the “Median Multiple” (median house price divided by median household income). The ratings are as follows:
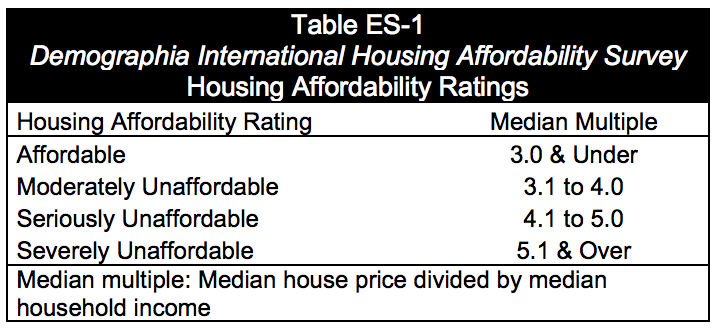
Table of Affordability
http://www.demographia.com/dhi.pdf
These rating categories were determined by the ‘Demographia International Housing Affordability Survey’, and have been recommended by both the World Bank and the United Nations. These recommendations from highly trusted organizations gives substantial evidence that the categories can be trusted. They additionally appear trustworthy because of the very extensive list of countries and metropolitan regions that it spans, which can cause less uncertainty and error in the data.
Is affordability a good indicator of a city’s ‘livability’?
A city cannot be deemed livable if housing is unaffordable, and therefore affordability is definitely an indicator towards whether a city is livable or not. However it is not the only factor that must be included when determining livability. Aspects such as the economic, environmental, social, and political atmosphere are very important to consider. Additionally, employment prospects, entertainment opportunities, and educational institutes may all be factors. Therefore whether a city is ‘livable’ or not is based on affordability, but also needs to take into account a variety of other variables.
Final Maps:
The following maps produced for this lab show housing cost in Vancouver and Ottawa, affordability in Vancouver and Ottawa, as well as a comparison of different data classification methods in Vancouver.
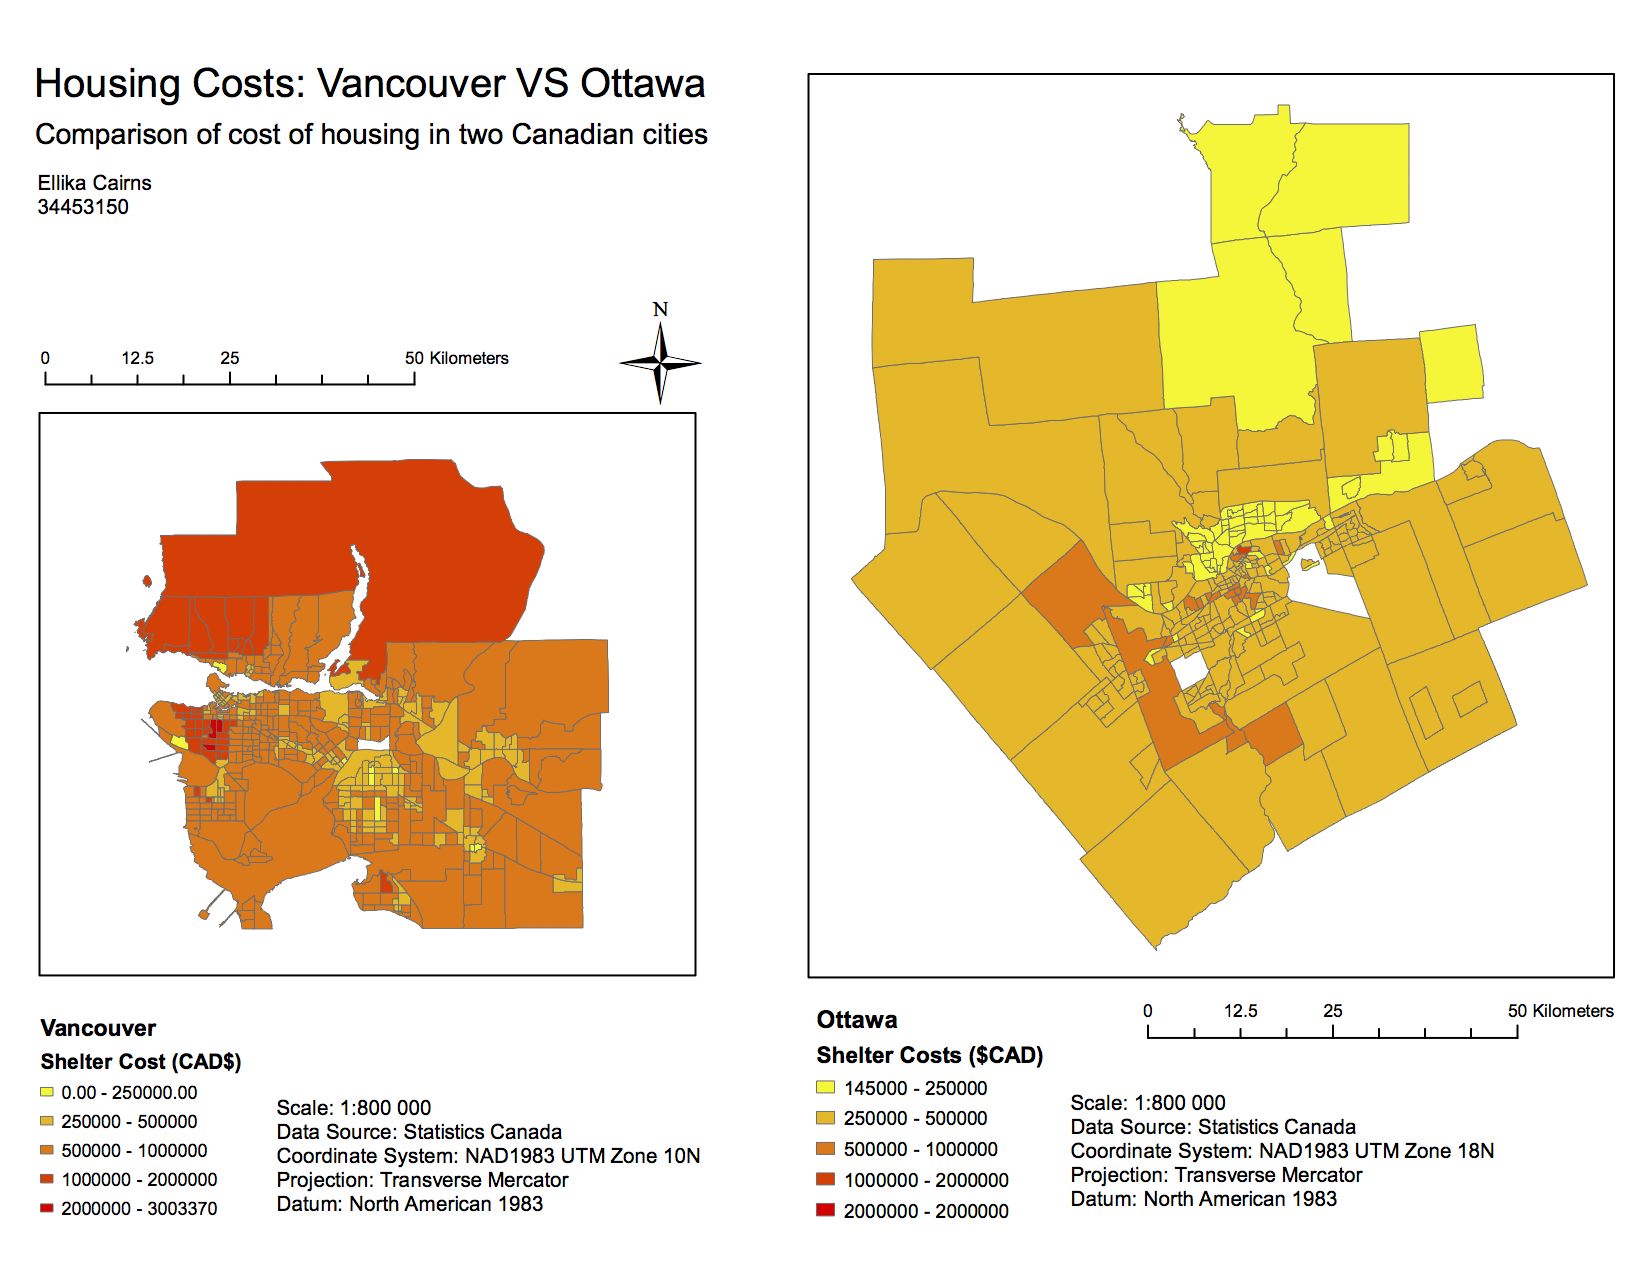
Lab 4 map: Housing Cost in Vancouver and Ottawa
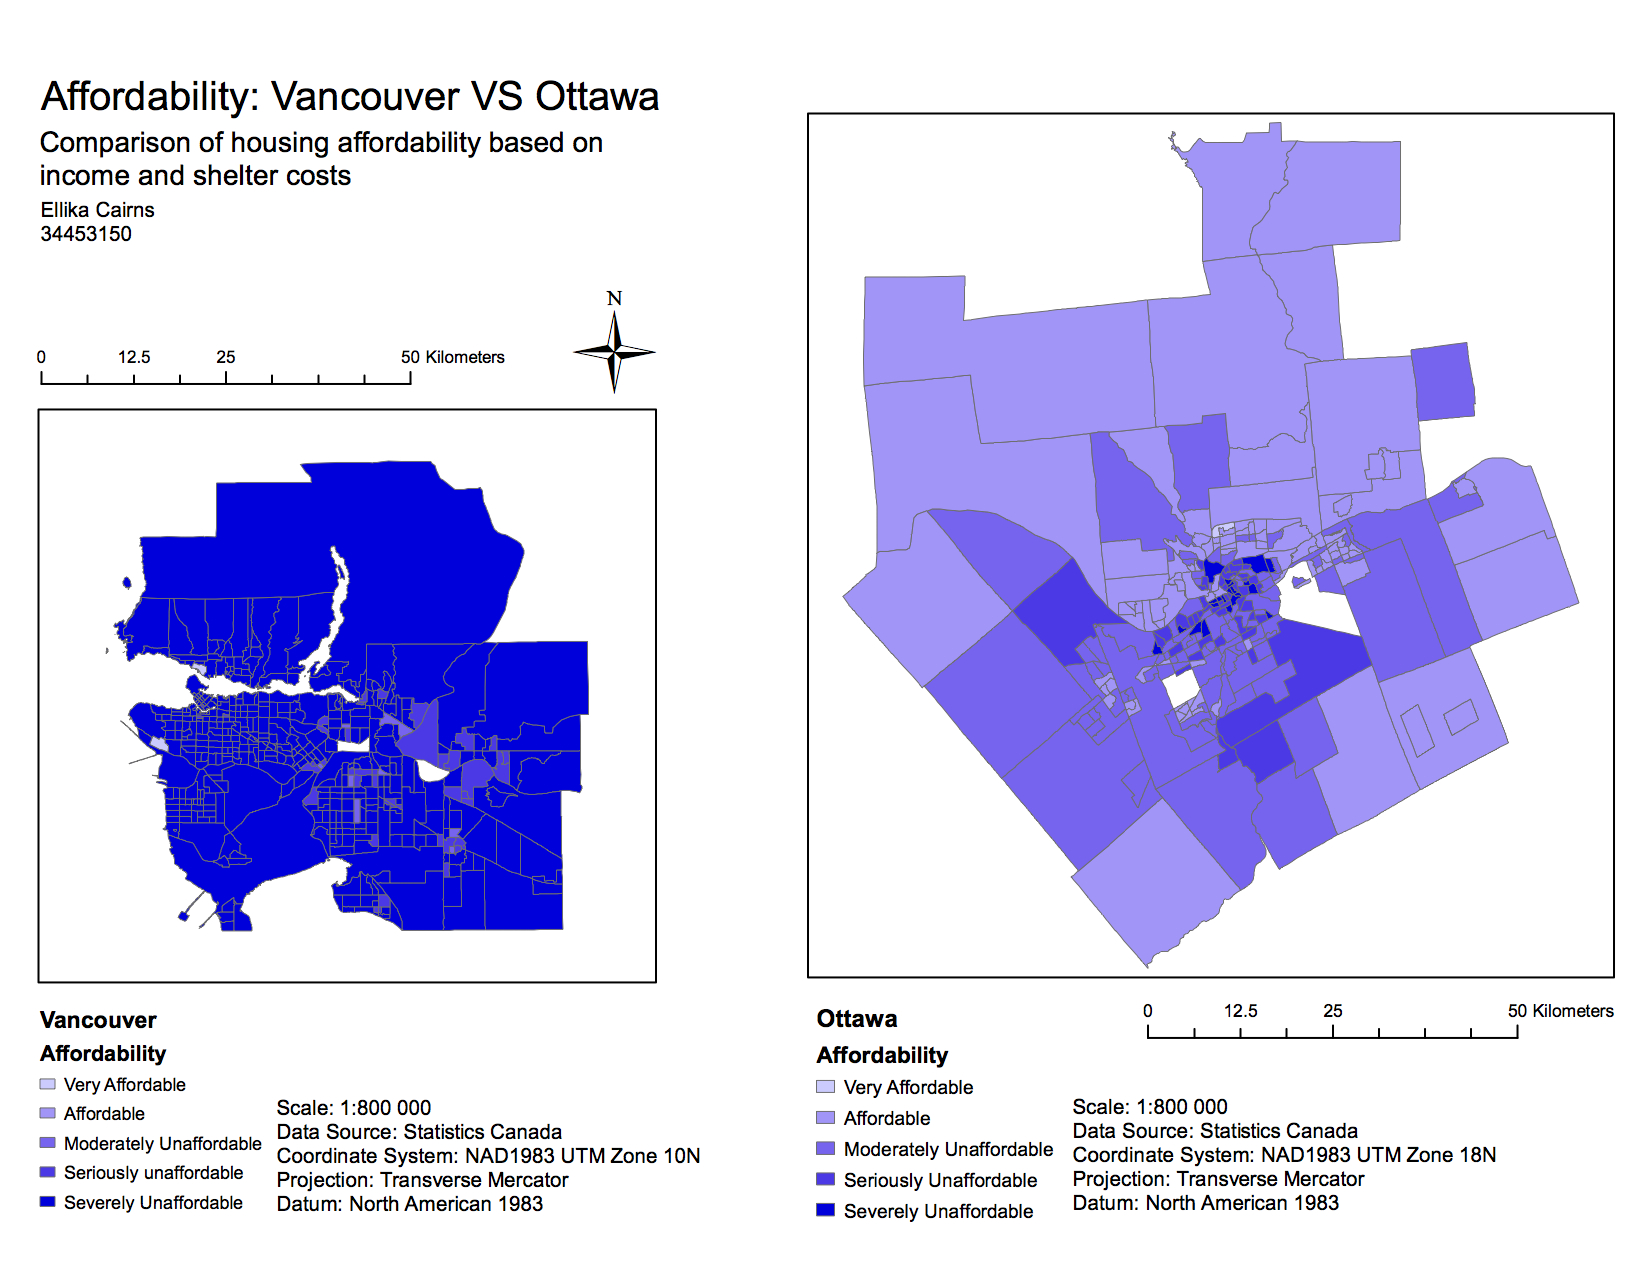
Lab 4 map: Housing Affordability in Vancouver and Ottawa
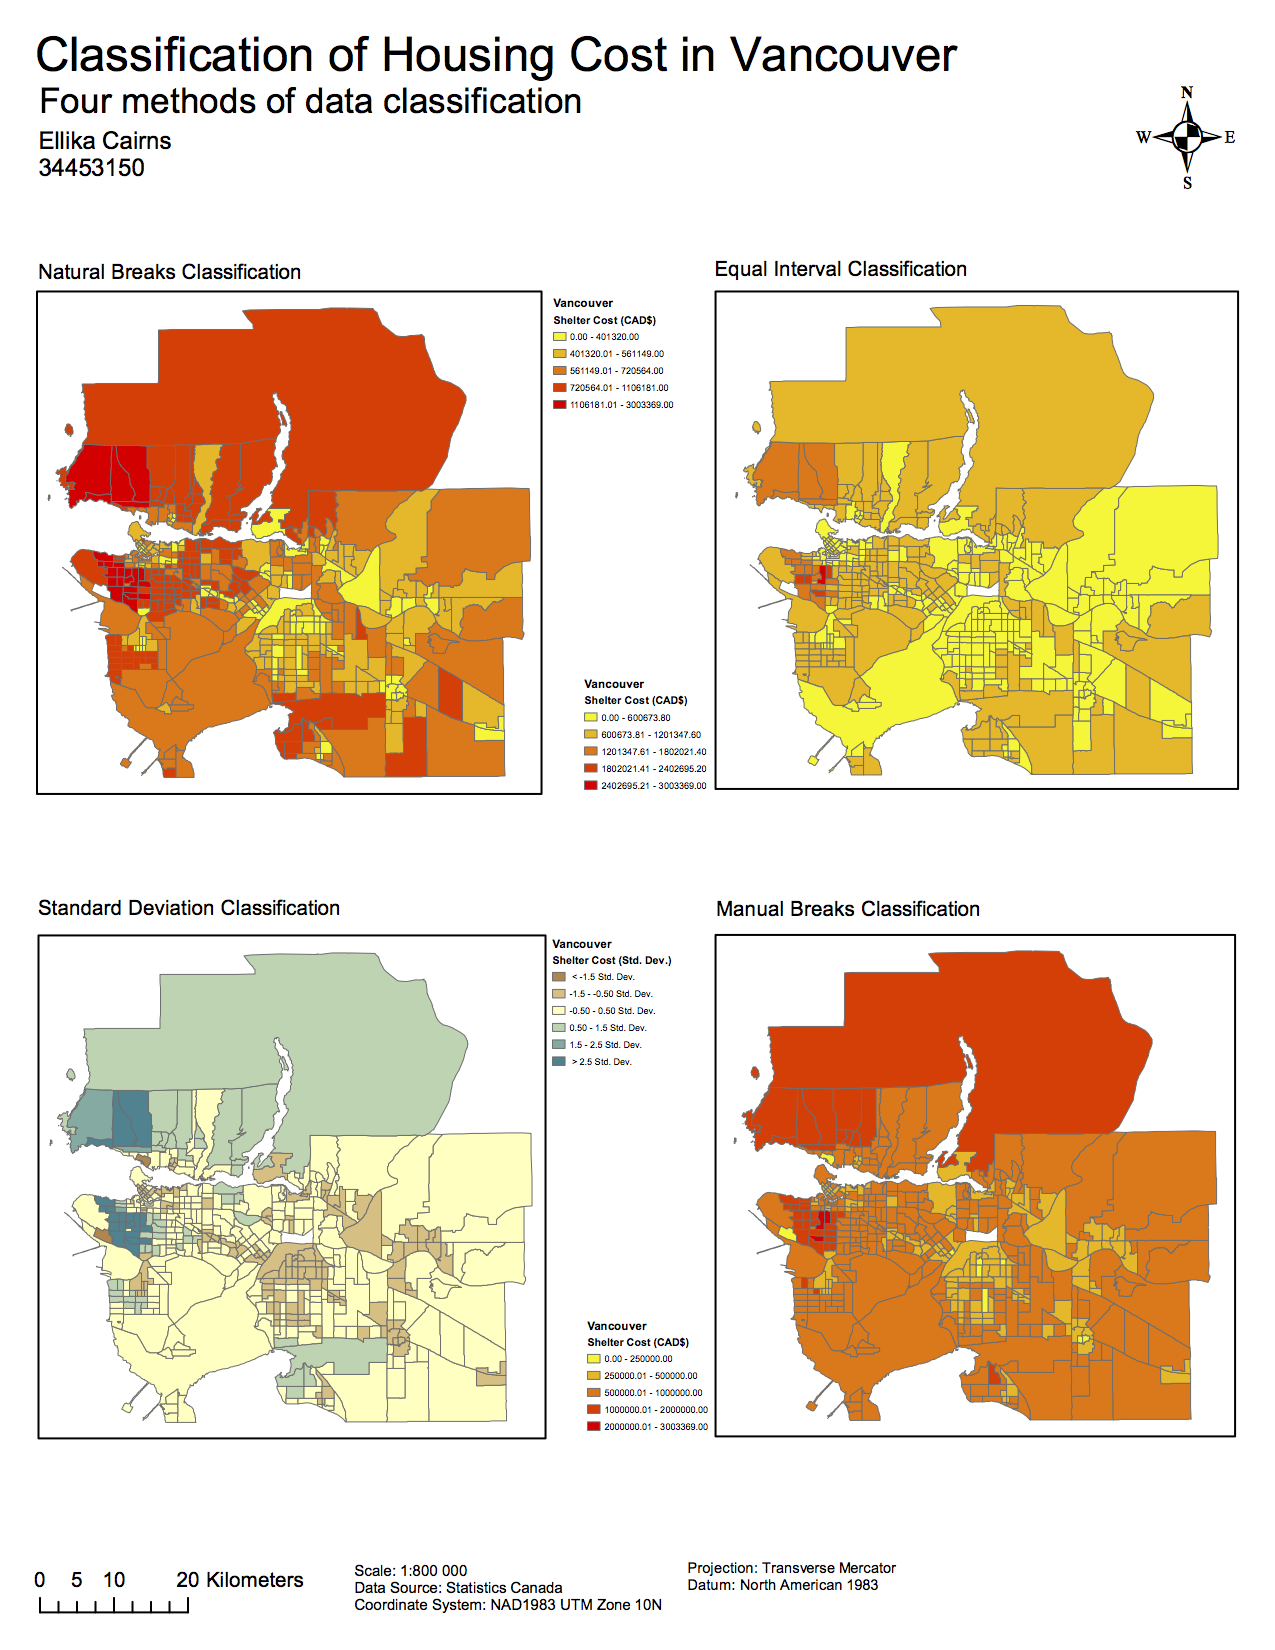
Lab 4 map: Data Classification Methods