Lab 3 – Planning for a Tsunami
In this lab, we were working through a scenario as if we had been hired by the City of Vancouver’s GIS department. Our task was to create a map that highlights any areas in the city that are at a high risk in the event of a tsunami. See the bottom of this post or click here for the map.
Accomplishment Statement:
Through working towards this final map, became more experienced in completing many new tasks in ArcMap. Firstly, I gained an understanding of how buffer proximity analysis functions. In this lab, the buffer tool was used to find areas within 1km of the shoreline, which are the areas at higher risk of flooding in the case of a tsunami. I also learned how to portray the basic map elements in ArcGIS such as a legend, north arrow, title, coordinate system, datum, scale bar, etc. These elements are all paramount in the production of a legible map, as they are how a viewer engages with the data presentation and obtains information from it.
Reflection Questions:
What percentage of the City of Vancouver’s total area is under danger? Explain the method used to determine this percentage.
Methodology:
- Right click on the layer Vancouver_Landuse > Attribute Table
- Right click on Shape_Area > Statistics…
- The Sum is the total area of that layer (131 020 600.023 m2)
- Repeat steps 1-3 for the layer Vancouver_Danger (getting the value 20 314 805.881 m2)
- Calculate the percentage of affected land with the following math: x/100 = 20 314 805.881 / 131 020 600.023 = 15.505%
Therefore the percentage of Vancouver’s total area that is affected by the potential tsunami is 15.5%.
List the healthcare and educational facilities within the Vancouver danger zone, if any. Explain how you came up with your answer.
Methodology:
- Under Catalog, expand Toolboxes > System Toolboxes > Analysis Tools.tbx > Extract > Clip
- In Input Features, enter Vancouver_education
- In Clip Features, enter Vancouver_Danger
- In Output Feature Class, enter C:\temp\lab3\analysis.gdb\ Education_in_danger
- Click OK
- Repeat steps 1-4 for the Vancouver_health layer, naming the Output as Health_in_danger
- Open the attribute tables of each new layers, to find which facilities are potentially affected.
Education facilities in danger:
- St Anthony of Padua
- Ecole Rose Des Vents
- Heritage 3R’s School
- Vancouver Montessori School
- False Creek Elementary
- Emily Carr Institute of Art & Design (ECIAD)
- Henry Hudson Elementary
- St John’s International
- St Francis Xavier
Institute of Indigenous Government (IIG) Health facilities in danger:
- False Creek Residence
- Broadway Pentecostal Lodge
- Coast West Community Home
- Yaletown House Society
- Villa Cathay Care Home
Final Map:
As the final product of this lab, a map was produced to portray the areas at risk of flooding in the case of a tsunami in the City of Vancouver. The final map can be seen below.
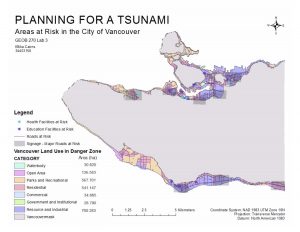
Lab 3 map: Planning for Tsunami – Areas at Risk in the City of Vancouver