Monthly Archives: March 2015

Week 9 Review

GIS and Crime

There is some controversy in the crime field in regards to how important/useful environmental considerations are. Some crime specialists believe geography/the environment don’t play a big role.

Example of GIS/Crime:

Greed/Envy/Wrath maps of the US:

Greed shows average income compared with number of people below poverty line

Envy – total thefts per capita

Wrath – number of violent crimes per capita

Routine activities theory (RAT):

Theory that crime is based on routines – both of the criminals and the targets. This theory highlights temporal and socioeconomic aspects of crime, but does not consider the spatial, and thus geographical aspect.

Crime Pattern Theory:

Crimes tend to happen in certain neighborhoods because that’s where the criminals live.

Environmental criminology

Environmental criminology is a related sub-discipline that considers the spatial distribution of offenses and offenders.

Marauders vs. Commuters

Example of geography use in crime:

Picton murders – Kim Rossmo figured out that the Picton murders were commuted by a serial killer, but it took 5 years to actually figure out it was Picton, because nobody would listen to him. Kim is a pioneer of geographic profiling.

 

Presentation Week

This was our second week of presentations, this time looking at Health Geography rather than landscape ecology. My paper looked at the relationship between residential slopes and likelihood of diabetes in Perth, Australia.

Paper reviewed: People living in hilly residential areas in metropolitan Perth have less diabetes: spurious association or important environmental determinant?

Focus of study: Built Environment Factors that affect Diabetes prevalence

Research question: Is there a link between neighborhood slope and likelihood of having diabetes?

Researchers’ Hypotheses:

  • People that live in higher-slope areas will have a smaller chance of contracting diabetes, due to higher exertion during any physical activity, such as walking

Methods:

  • West Australia 2003-2009 Health Survey data – 11,406 individuals / 964 with Diabetes
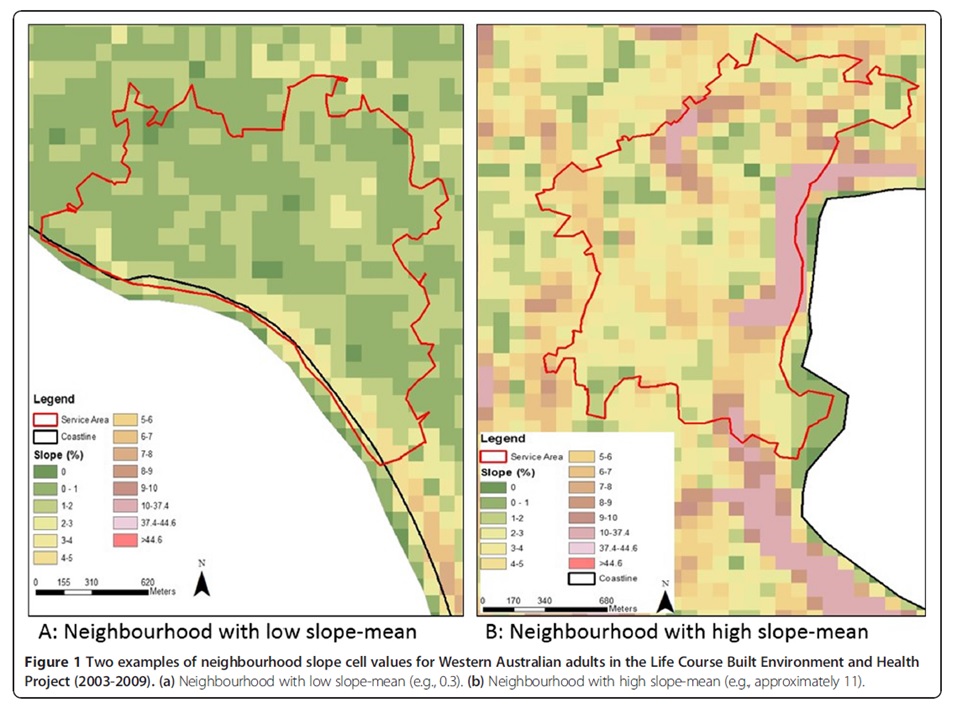
  • Physical location of every individual -> created 1600m long neighborhood around every home
  • 90m DEM map of Perth showing slope placed on top
  • 5 groups of confounding variables also collected: socio-economic, distance to important destinations, walkability, diet, amount of time walking

examplemap

Analysis:

  • SPSS software program used to look association between slope and diabetes, and also between diabetes and confounding factors
  • 5 models produced, each accounting for more of the confounding factors

Results:

  • Strong association found between slope and diabetes, even after accounting for confounding variables – 13% lower odds of having diabetes for every 1% increase in mean slope

Conclusion:

  • Paper had many limitations
  • The researchers don’t explain how adjusting for confounding factors was done
  • association could be false, caused by confounding factors
  • slope for each neighborhood was averaged out, may not represent actual walking route slope
  • could’ve employed GWR
  • 7/10

Other presentations:

The one thing that really struck me with this round of paper reviews is how similar they were in format. For example, a lot, if not most of the papers had Odds Ratios within a Confidence Interval to show relationships, rather than correlation coefficients. Another trend I noticed is that the researchers focused a lot on their own limitations.

It seems like research in Health Geography is focused on trying to be as careful as possible when making conclusions from their research, and looking at association rather than causation, because of how complex health-related issues are.

Weekly Review – Week 8

GIS in health geography

This lecture follows up from the health geography lecture from last week. The goal of this lecture is to consider all of the nuances related to using GIS and health geography, and to provide examples of GIS and health geography.

Spatial epidemiology is arguably the biggest application/subfield of health geography. It seeks to understand and describe the spatial variation of diseases. It draws largely upon ego-referenced health and population data kept by governments – e.g. recorded information about an individual’s visit to the doctor. Spatial epidemiology is largely focused on the individual level and small areas; otherwise it is impossible to see how diseases originate, spread, and so on.

Some Issues

Aligning different spatial units is difficult for GIS and health geography -e.g. different sizes/boundaries for various types of administrative districts. Data on population movement is also difficult to find – e.g. people migrating over long time periods, as well as daily movements.

Environmental hazards are a big component of GIS in health geography, because they can be mapped well.