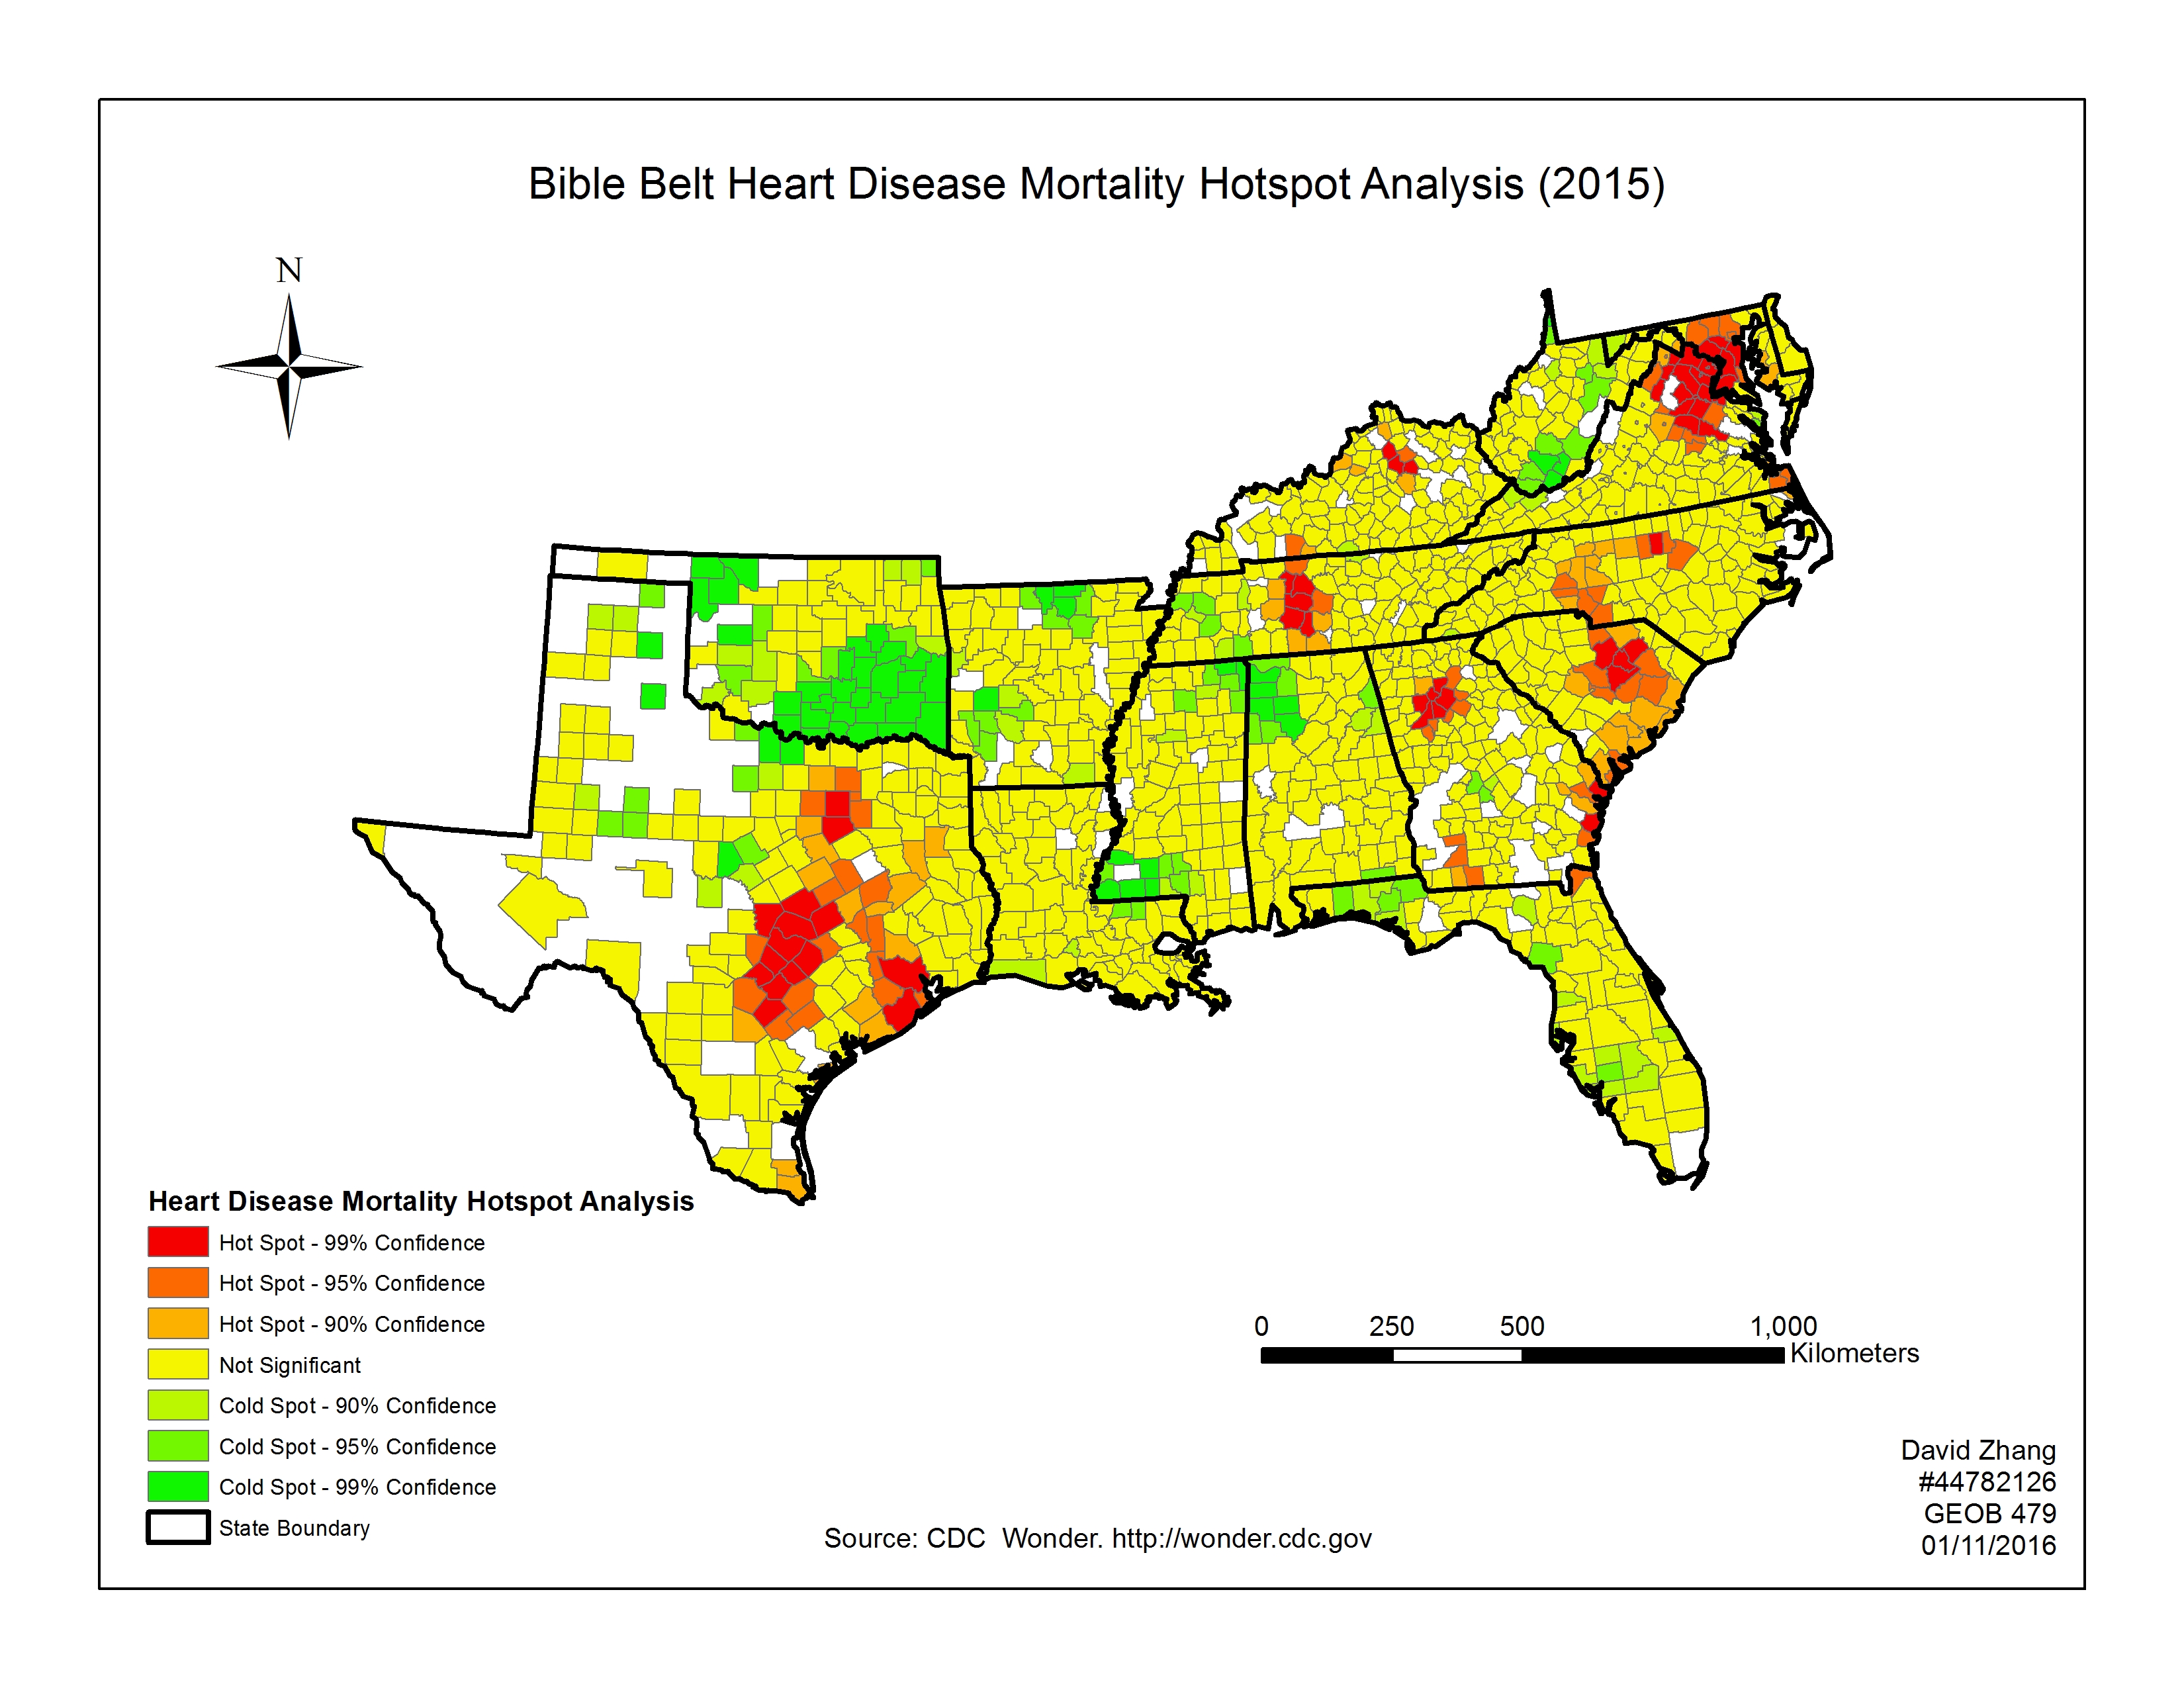
Lab 1: Spatial Stats Using Model Builder
In this lab we created yearly hot spot maps of heart disease in Southern United States using data from CDC Wonder Data and Model Building in ArcGIS. The data we worked with ranges from 1999 to 2015. After creating a hot spot map for each year we animated yearly hot spot feature maps. The major take away for this lab is how to properly create a map using correct map format and elements. Below is a hotspot map for heart disease in Southern U.S. in 2015
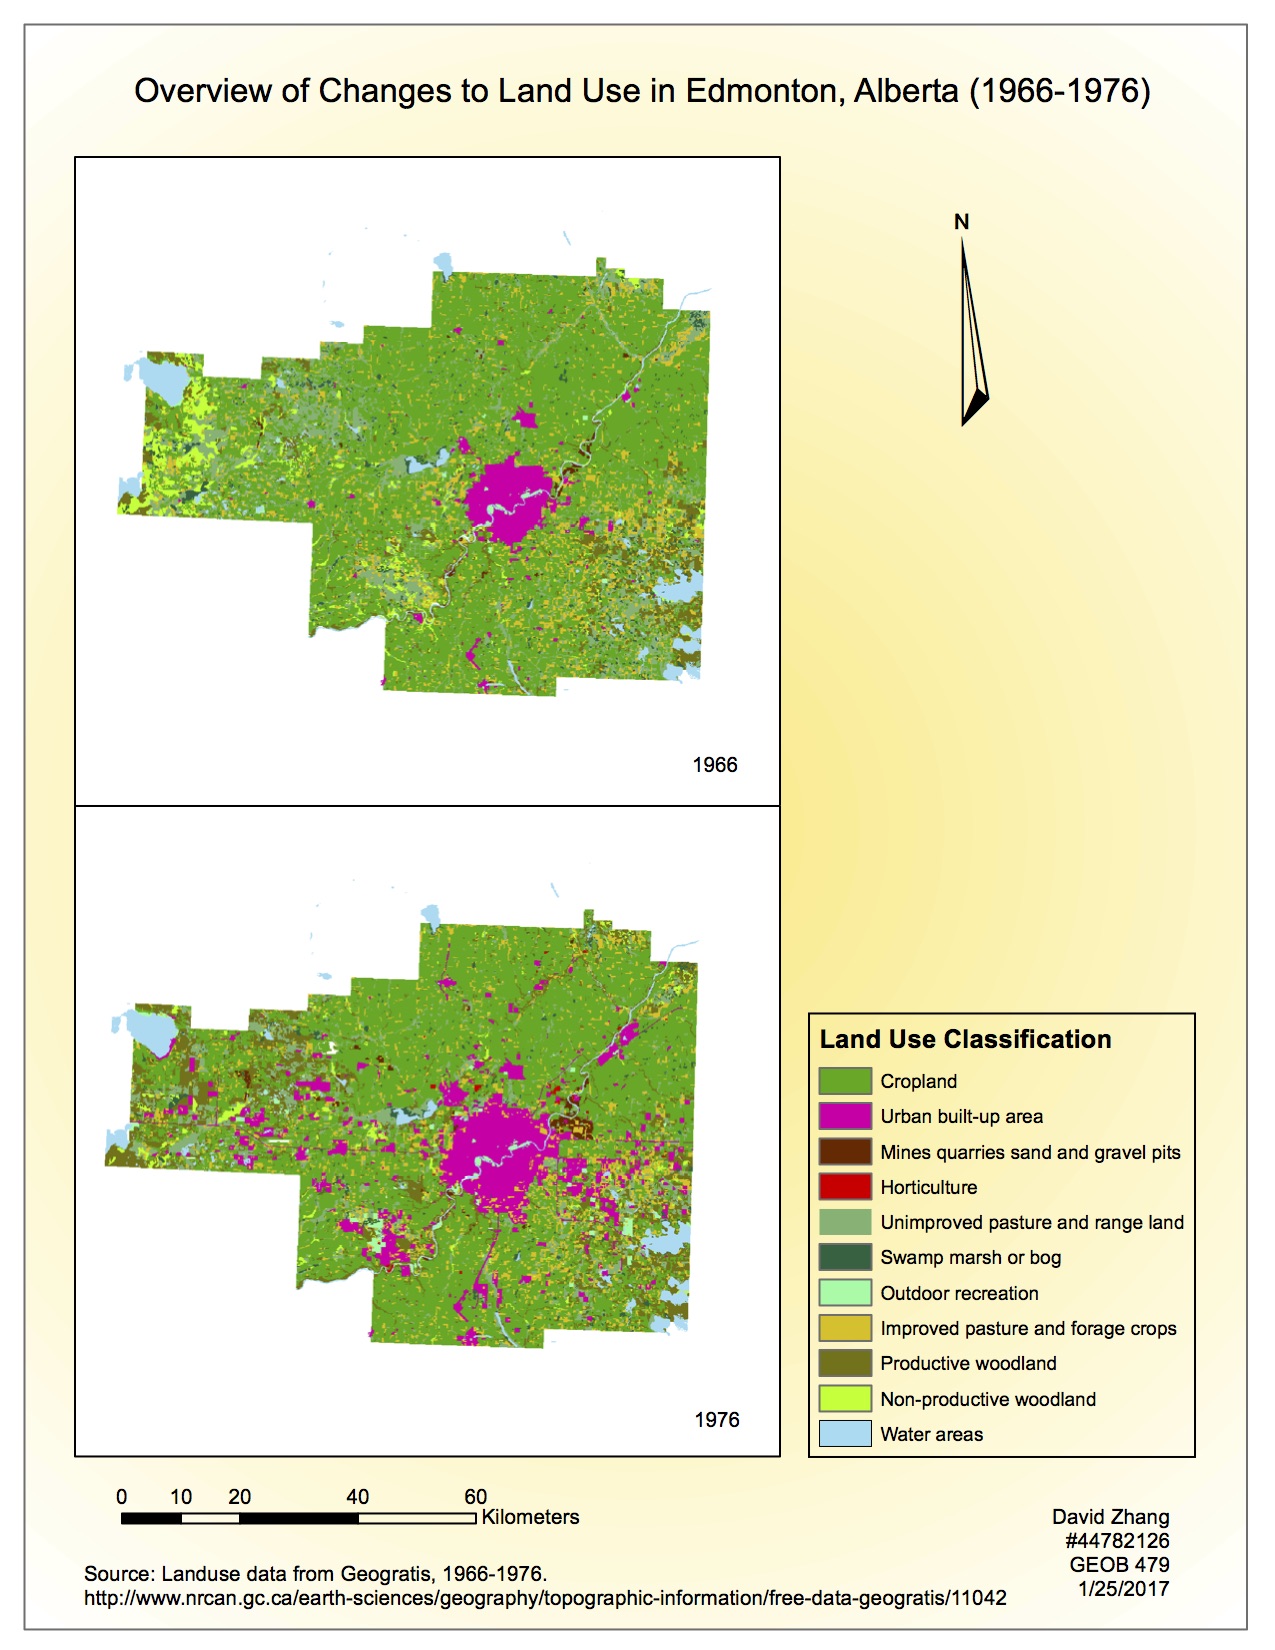
Lab 2: Exploring Fragstats
FRAGSTATS is a computer software program designed to compute a wide variety of landscape metrics for categorical map patterns. In this lab we used FRAGSTATS to analyze changes in landscape around Edmonton, Alberta from 1966-1976. We then created a transition matrix from statistical data we obtained from Fragstats to show changes in landscape . Finally, to illustrate the change, we created two maps, showing land use of the whole study area for both 1966 and 1976. The final report should be in the perspective of a consultant to examine the changes in the land use around the area of Edmonton. Below is an overview of land use in Edmonton, Alberta.
Lab 3: Introduction to Geographically Weighted Regression (GWR)
In this lab, we assessed the relationship between a child’s sociability scores to a set of variables (family income, language skills, gender, parental status) and to their neighborhood. In terms of analysis, we used both ordinary least square (OLS) and Geographically weighted Regression (GWR). While OLS provides predictions or to model a dependent variable based on explanatory variables at a global scale, GWR does the same but at a local scale. Finally we compared the results from both analysis and illustrated the difference in maps. Below is a map…
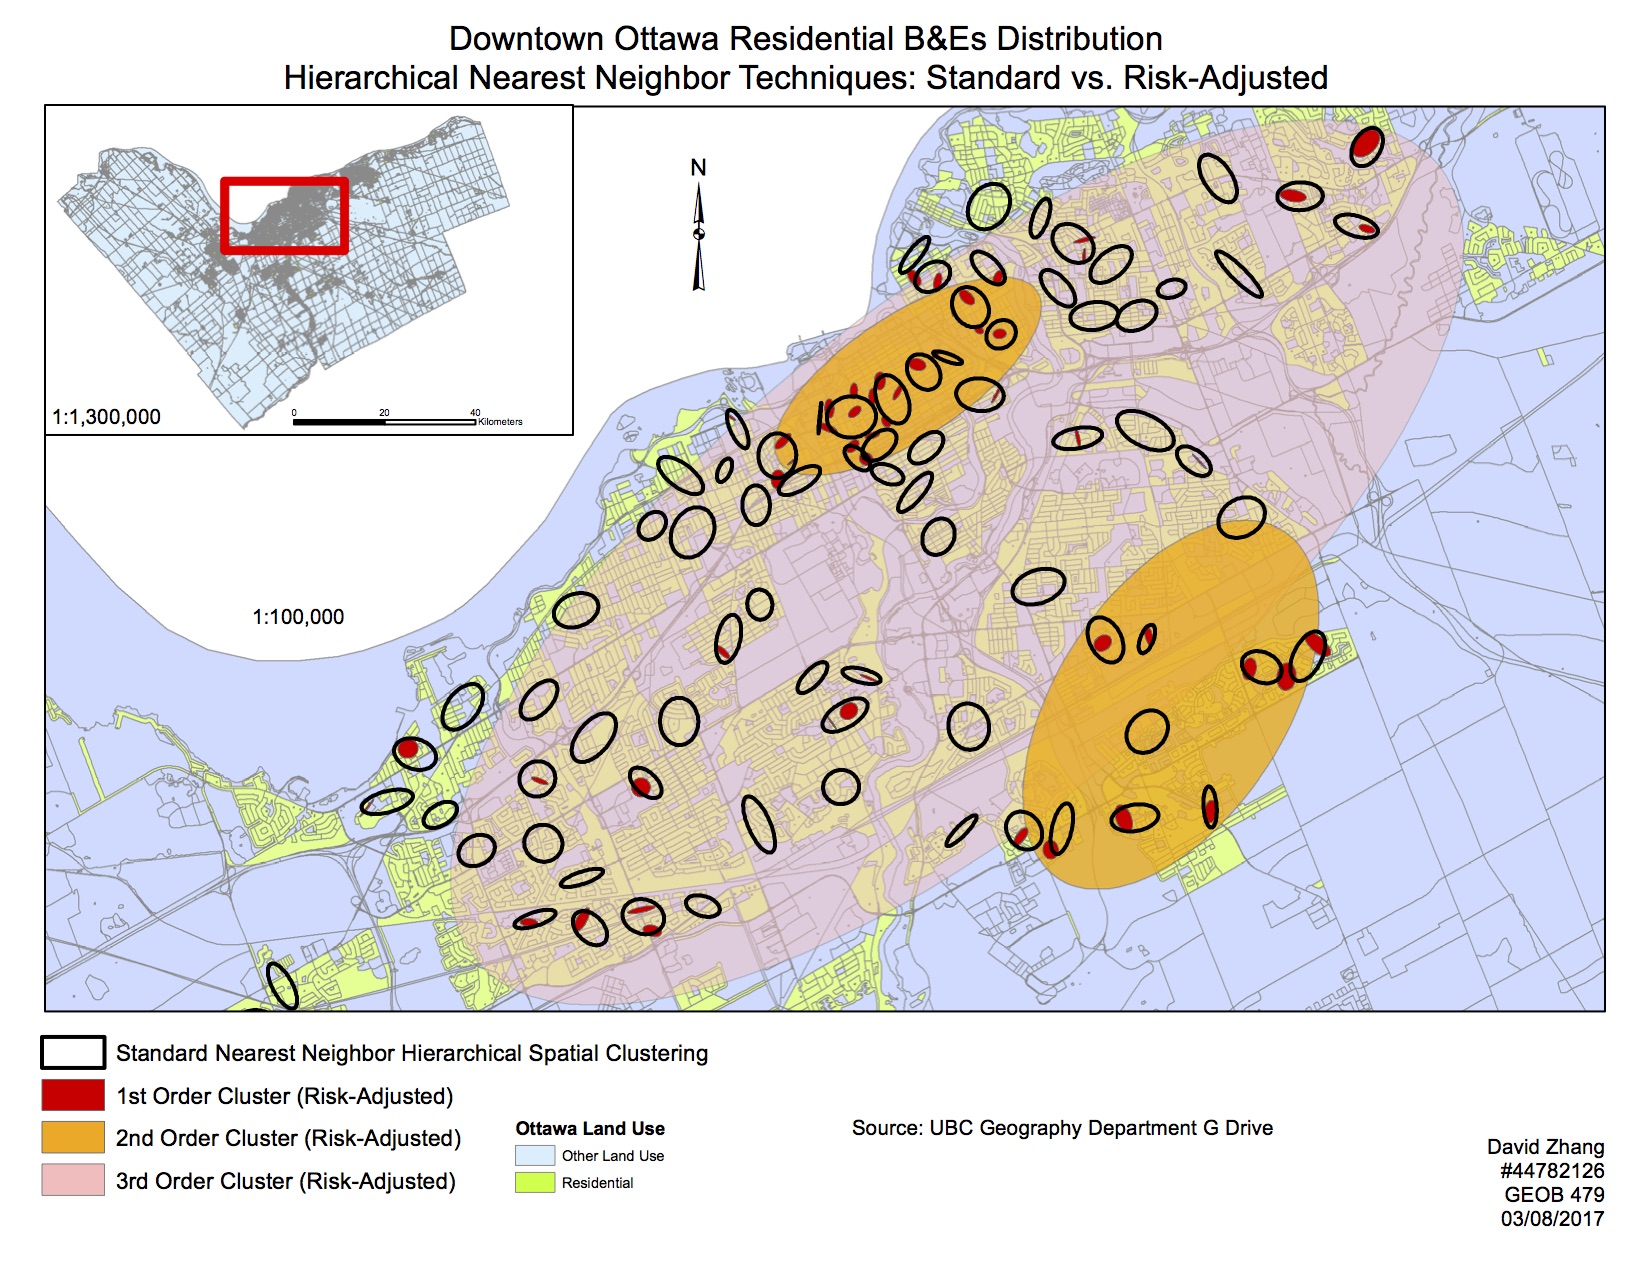
Lab 4: Crime analysis using CrimeStat
In this lab we used CrimeStat to analyze crime patterns in Ottawa, Ontario. In terms of analysis, we used a variety of statistical methods within CrimeStat which includes nearest neighbor analysis, knox index, moran’s I, hotspot analysis (fuzzy mode, nearest neighbor hierarchical spatial clustering) and kernel density estimation to find criminal spatial patterns at both global and local levels. We then compared the different statistical methods by looking numbers and maps. Here is a map that illustrate the difference of results between standard and risk adjusted hierarchical spatial clustering.