
Model 3: Future Climate Variables
As mentioned in the methodology section, all training inputs for Model 3 were the same as Model 2 thus the same outputs and diagnostics were produced and have not been replicated here. You may refer them in the section Model 2.
Where Model 2 and Model 3 differ is their predicted raster outputs, as Model 3 uses future climate data as predicted outputs.
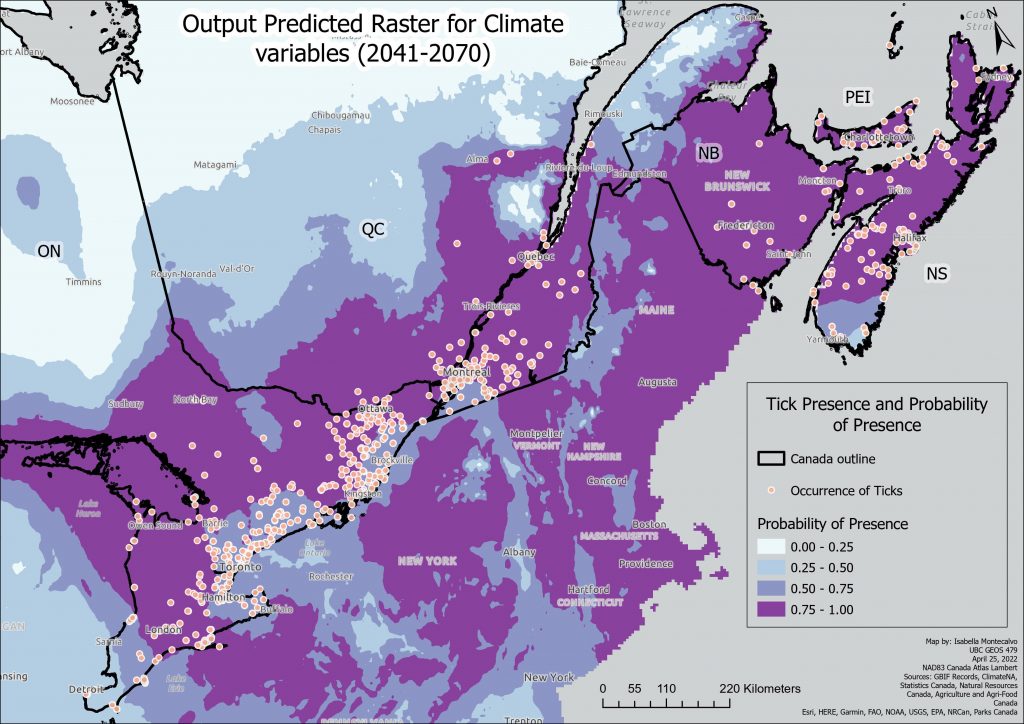
A higher resolution PDF version can be found here: Output Predicted Raster Future Climate Variables.
As can be seen from Figure 32, there is significant northward expansion of the probability of tick presence based on future climate variables. The model predicts a very high probability (almost certain) that there will be tick expansion into the immediate areas north of original high probability areas and areas that have occurrences of ticks. More of Quebec is predicted to have ticks (25-50% prediction), all of New Brunswick and Nova Scotia.
A smaller scale map to show the full extent of the expansion in Model 3 has been created and the same scale map has been provided for Model 2’s predicted output for comparison .
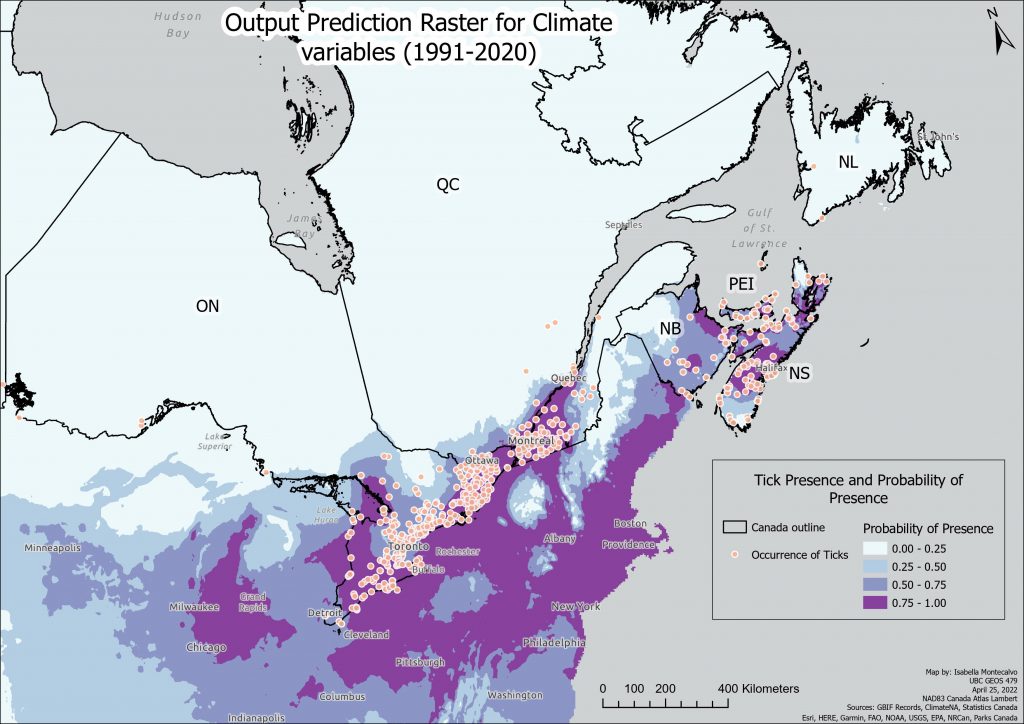
A higher resolution PDF version can be found here: Small Scale Predicted Raster Current Climate Variables.
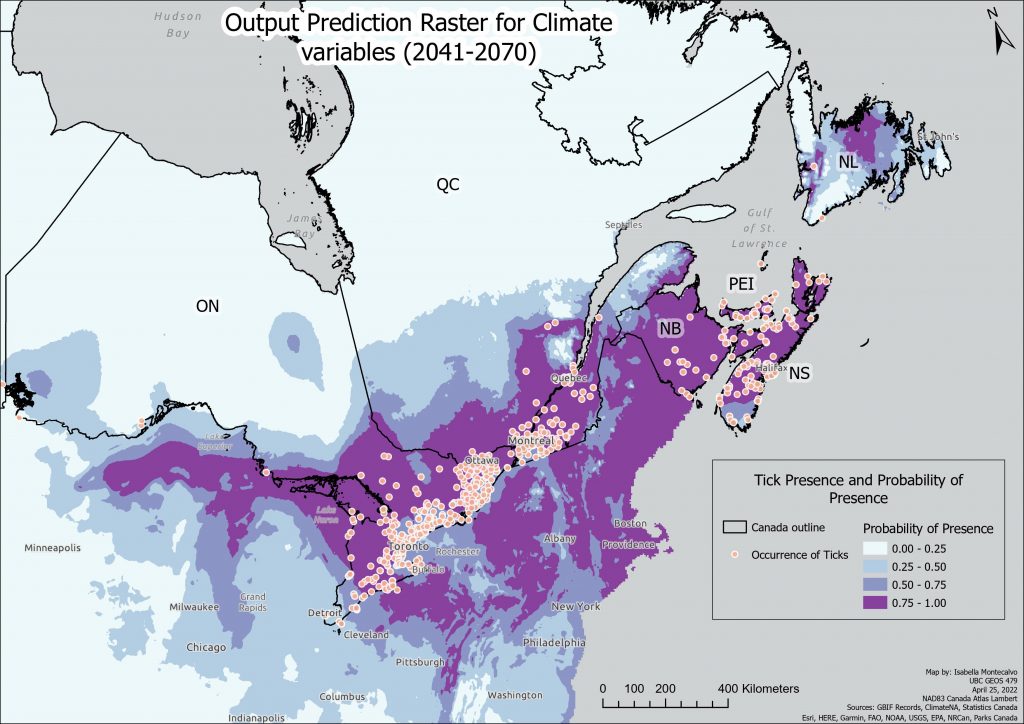
A higher resolution PDF version can be found here: Small Scale Predicted Raster Future Climate Variables.
As can be seen from the comparison of these two maps, there is the probability of expansion to the north and the west in Ontario, high probability northward in Quebec, New Brunswick, and Nova Scotia. Concerningly, the model has also predicted that Newfoundland and Labrador is likely to experience the presence of ticks in another 20 years.
I have also included a map that shows the full extent (most of North America) of the Prediction raster map with future climate variables for tick presence.
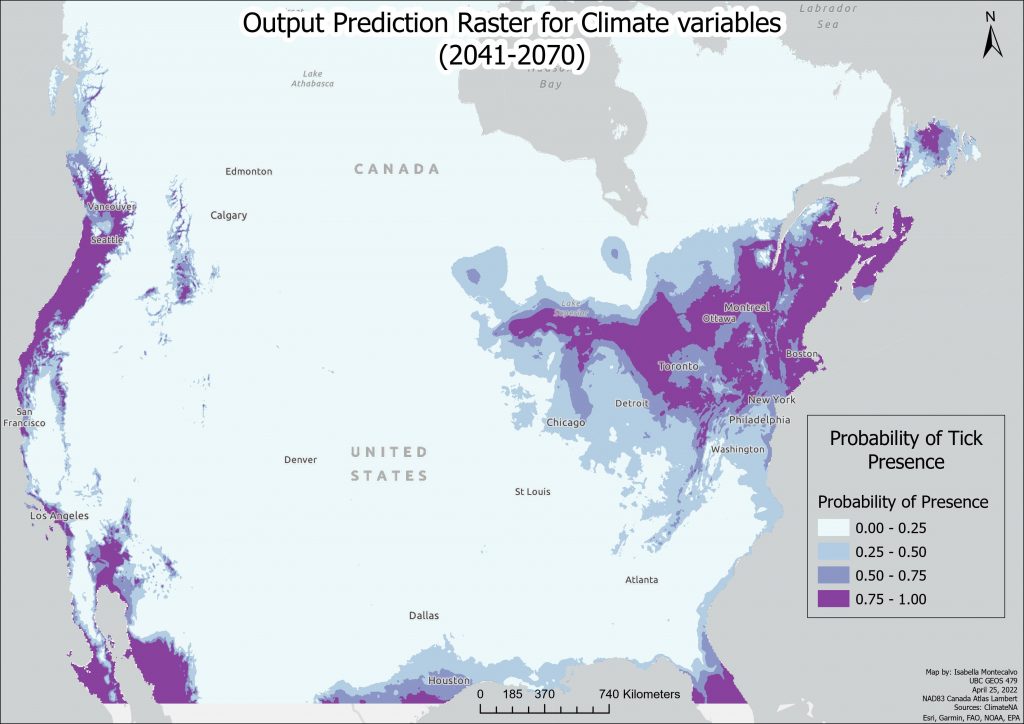
A higher resolution PDF version can be found here: Output Predicted Raster all of North America Future Climate Variables.
From the map, the model also predicts high probability of presence on the Western Coast near British Columbia, Washington and Oregon, which is actually a fairly good estimate by the model as currently those regions are experiencing rising cases of Lyme disease. Overall though, the highest probability concentration is in the northeast of North America. It is important to note that this is likely heavily influenced by sampling bias, as many tick occurrences have been recorded in this area.