In this lab we worked with the geographically-weighted regression – a spatial analysis tool that looks at non-stationary spatial variables in order to model the interrelationships between these variables using multiple regressions. Non-stationary variables are those that vary or “drift” spatially, such as demographic factors and many others (Leung, 2000). The GWR multi-regression model produces a raster surface by running a regression for every variable and assigning a coefficient value for each independent variable for every cell. The cells closest to a data point are assigned a higher value than those further away. The cells with corresponding coefficient values then produce a tessellation that depicts the spatial variations between the dependent and independent variables (Columbia University, n.d.).
The coefficient of determination R2 that is produced by running GWR is simply put a “goodness of fit” that determines the amount of variance in the dependent variable that is correspondent to the independent variable. The values range from 0 to 1 with 1 indicating the best model fit. This variable is very important to look at when determining the success of the model in explaining spatial autocorrelation (Legg et al., 2009).
After running the Ordinary Least Squares (OLS) and Geographically Weighted Regression tool a few maps were produced to show the difference in the produced results. The data used for this analysis was from UBC’s Early Development Instrument. The regression analysis began with the identification of the most important variables affecting a child’s social score. Through performing Explanatory Regression Analysis in ArcGIS and then comparing the adjusted R-squares to find the highest value and Akaike’s information criterion for the lowest values, 4 most important variables were identified: gender, ESL, lone parent and income. After identifying these variables the tool was run again this time with only the most important factors and adding language score. This produced 3 variables of interest: language score, gender and income. Then the OLS tool was run for the above to determine the associated statistics.
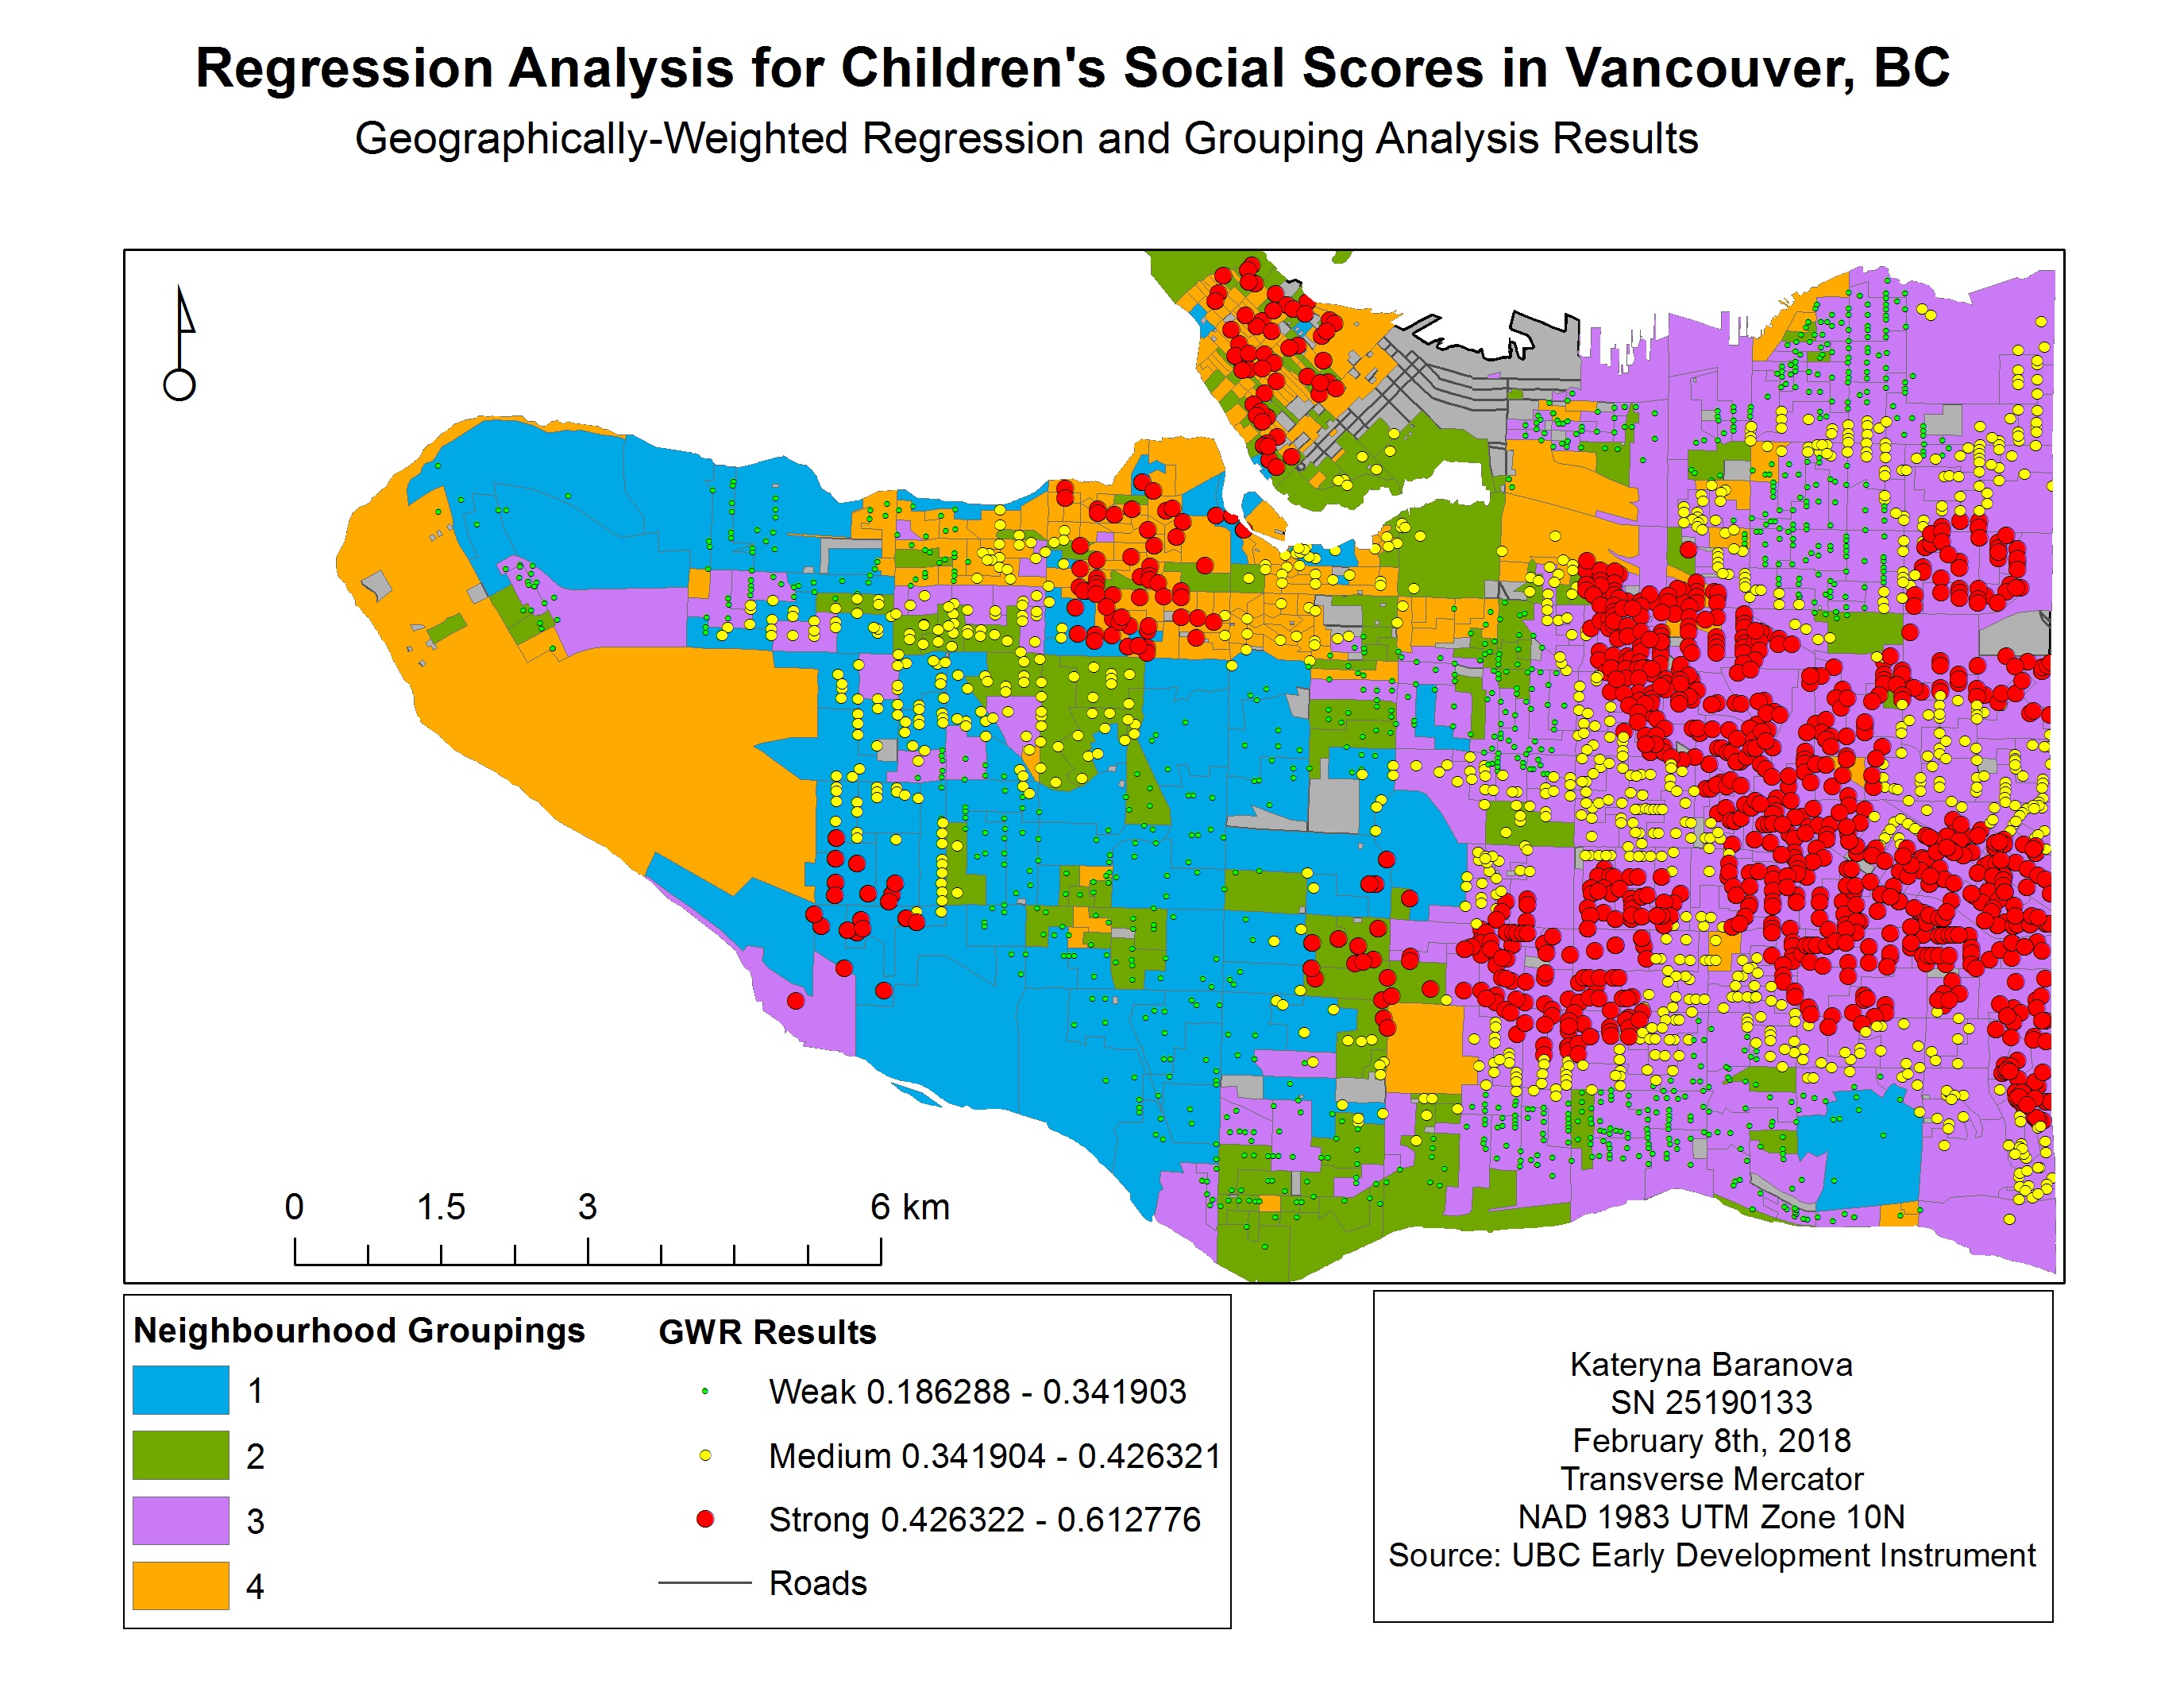
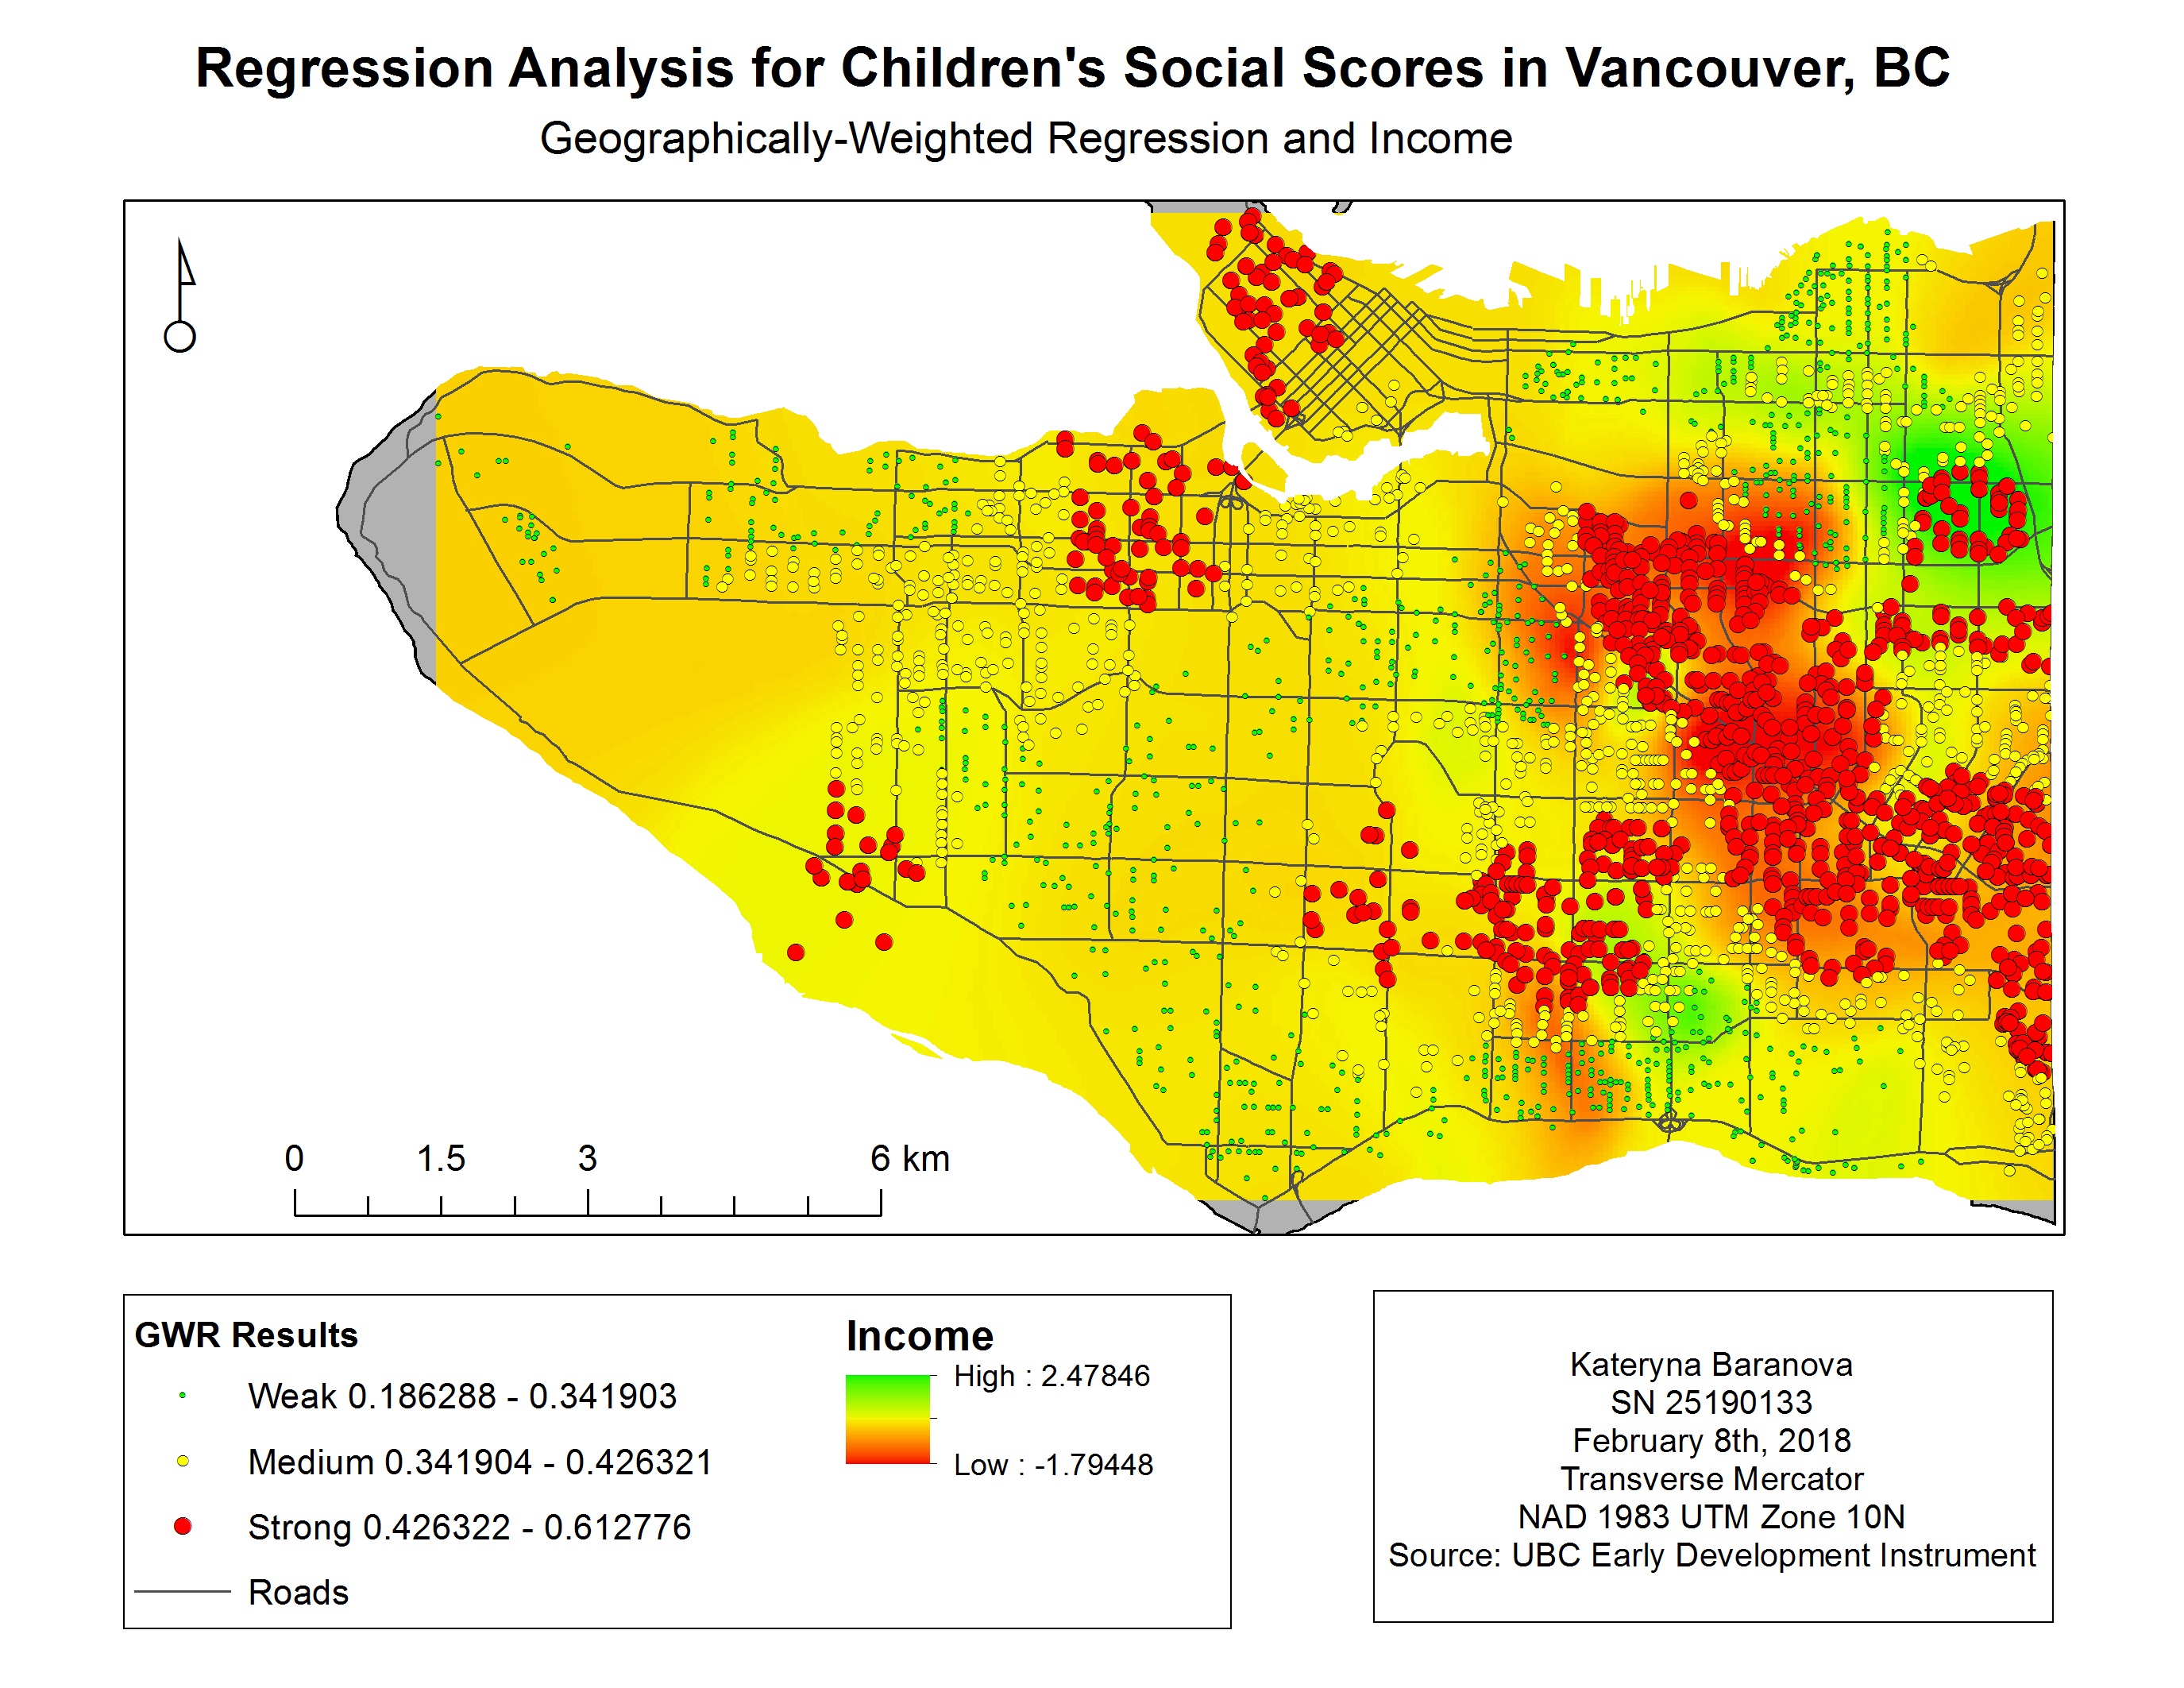
The results of the OSL and GWR analysis were mapped over the neighborhood groups to compare the two and determine which model is better suited for the data. We can see (Map 1) that the results produced by the OSL tool with the strongest fit are scattered all over the map, therefore not producing a meaningful model. With the GWR results (Map 2) we can see that the strongest R-squared values (i.e. best fit) are in clusters, therefore providing us with the most accurate results for east Vancouver, part of the Kitsilano area, Downtown and Northern Marine Drive area. The following maps (Map 3, 4, 5) represent the spatial distribution of language scores, gender and income respectively. The strongest spatial correlation is between social scores and language scores (Map 3) followed by income (Map 5) and quite ambiguous results for gender (Map 4).
Map 1. Ordinary Least Squares Results for Children’s Social Scores in Vancouver, BC
 Map 2. Geographically-Weighted Regression Results for Children’s Social Scores in Vancouver, BC
 Map 3. GWR and language scores for children in Vancouver, BC
 Map 4. GWR and gender for children in Vancouver, BC
 Map 5. GWR and income for children in Vancouver, BC

References
Columbia University. (n.d.). Geographically Weighted Regression. Retrieved from https://www.mailman.columbia.edu/research/population-health-methods/geographically-weighted-regression
Legg, R., Bowe, T. (2009). Applying Geographically Weighted Regression to a Real Estate Problem. ArcUser. Retrieved from http://www.esri.com/news/arcuser/0309/files/re_gwr.pdf
Leung, Y. (2000). Statistical tests for spatial nonstationarity based on the geographically weighted regression model. Environment and Planning, 3, 9-32. Retrieved from http://journals.sagepub.com.ezproxy.library.ubc.ca/doi/pdf/10.1068/a3162