In this lab we explored the space and time correlations in residential and commercial break and enters and vehicle thefts that occurred in Ottawa, Ontario between January 2005 and March 2006. We applied nearest neighbour statistics to identify clustering and compared them to spatial autocorrelation statistics such as Moran’s index. The knox index was then applied to look at spatio-temporal patterns in car thefts. Maps of the various clustering results and kernel densities were produced to visually examine the crime patterns and findings were discussed.
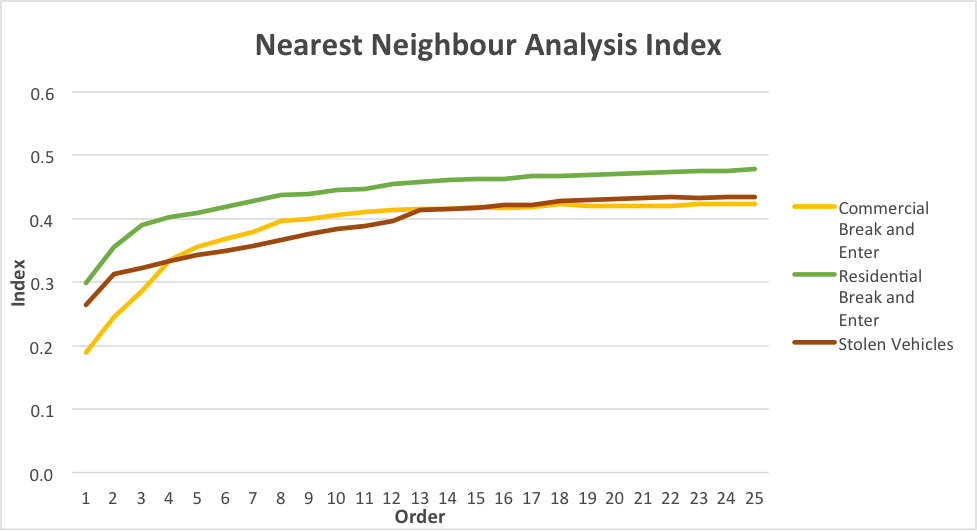
The 1st order break and entries and car thefts are more spatially aggregated than expected. This can be seen by looking at the nearest neighbor spatial aggregation indices on the graph. The index is a ratio of observed distance over mean random distance, so an index smaller than 1.0 indicates clustering (Levine, 2015).

The correlogram shows that spatial autocorrelation decreases exponentially with increasing class distance. A value of 0 represents complete randomness and no spatial autocorrelation. Residential break and enters are correlated the most (MI = 0.032449), followed by vehicle thefts and then commercial break and enters.

The fuzzy mode clusters can be seen in Map 1 as categories of coloured and sized points. The biggest and most red points indicate the highest frequency of residential break and enters committed within 1km and the smallest yellow points then indicate the smallest frequency. Clusters of red point then show where spatially there is the highest frequency of spatially correlated crimes. In Map 1 it can clearly be seen that most crimes happen in the core downtown residential area.
The nearest neighbour hierarchical spatial clustering is seen in Map 1 as purple ellipses. The ellipses delineate hotspots where at least 10 crimes have occurred within a 1km distance of each other.
Map 1. Fuzzy Mode Analysis Results

The nearest neighbour risk non-adjusted clusters depicted as purple ellipses in Map 2 do not consider population density. The nearest neighbour hierarchical spatial clustering analysis was then risk adjusted by normalizing crime frequency by population 15+. The analysis yielded 3 orders of clustering results. The first order or ellipses are the risk-adjusted hotspots where 10 or more crimes occurred within 1km of each other. The second order ellipses are clusters of the first order ellipses and the third order ellipses are clusters of the second order ellipses. In Map 2 we can see that the first order risk adjusted ellipses have the same general pattern, but are yet different from the risk non-adjusted clusters.
Map 2. Nearest Neighbour Risk Non-Adjusted and Adjusted Clustering Results

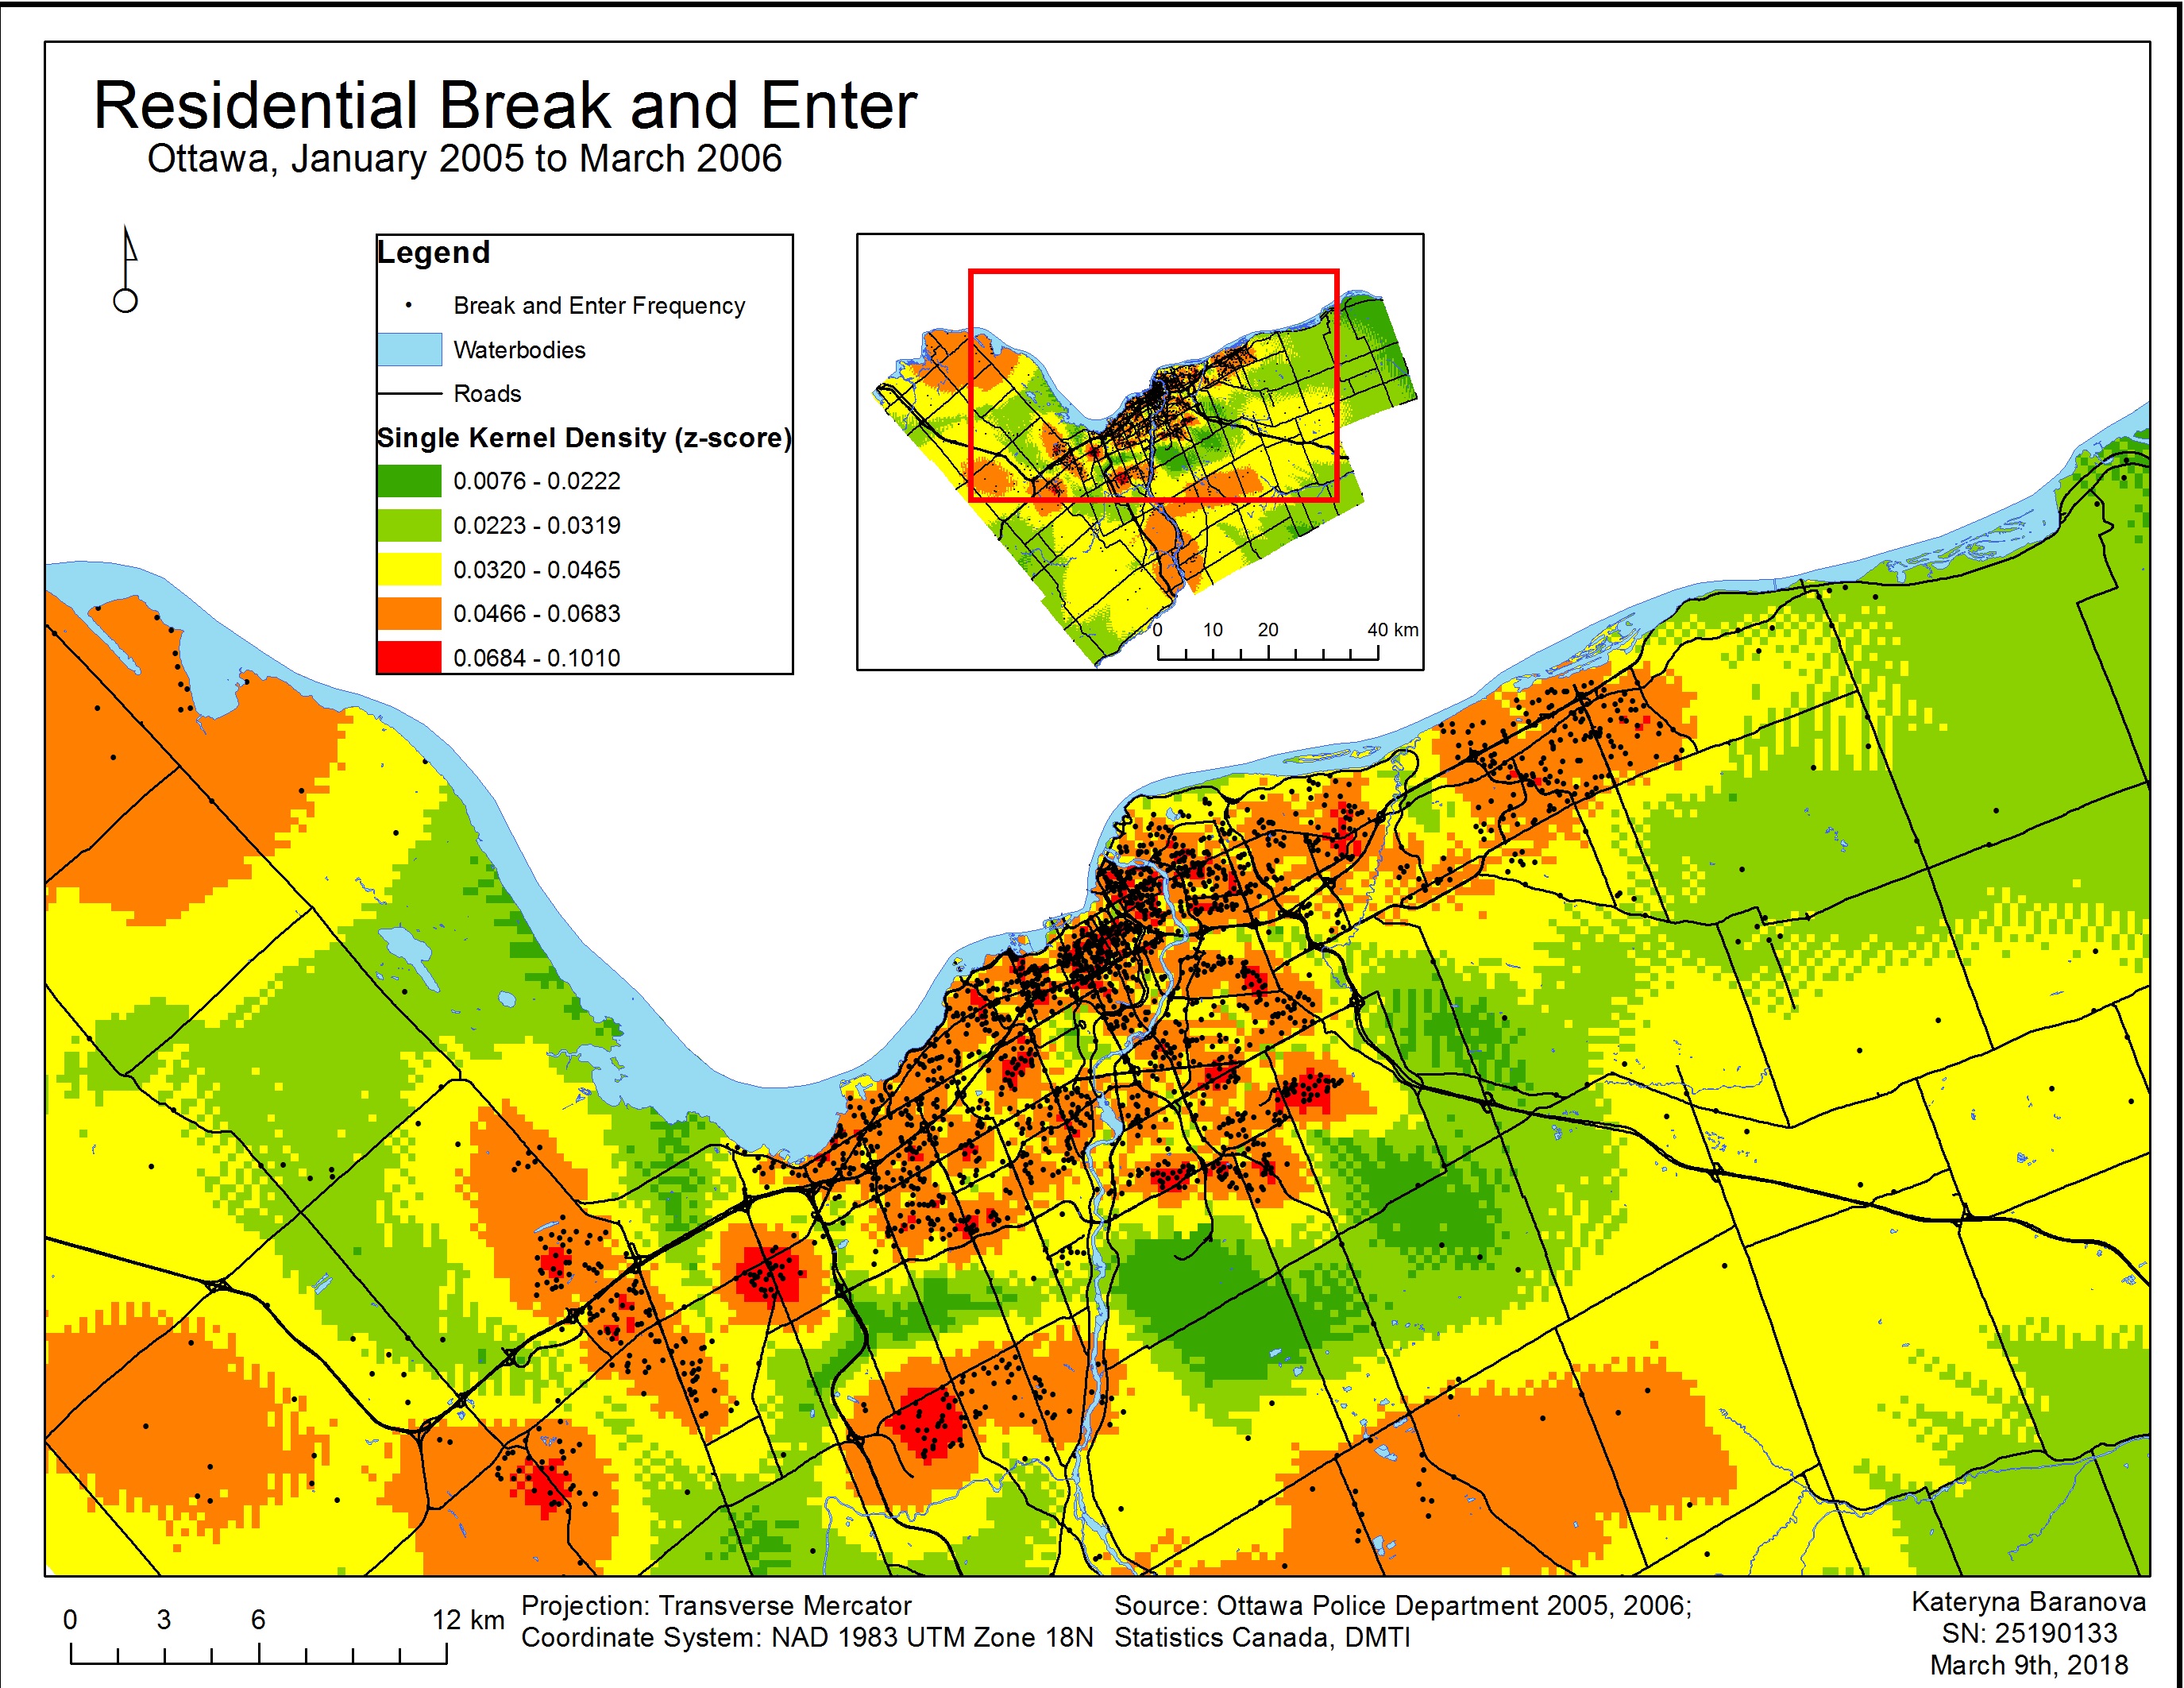
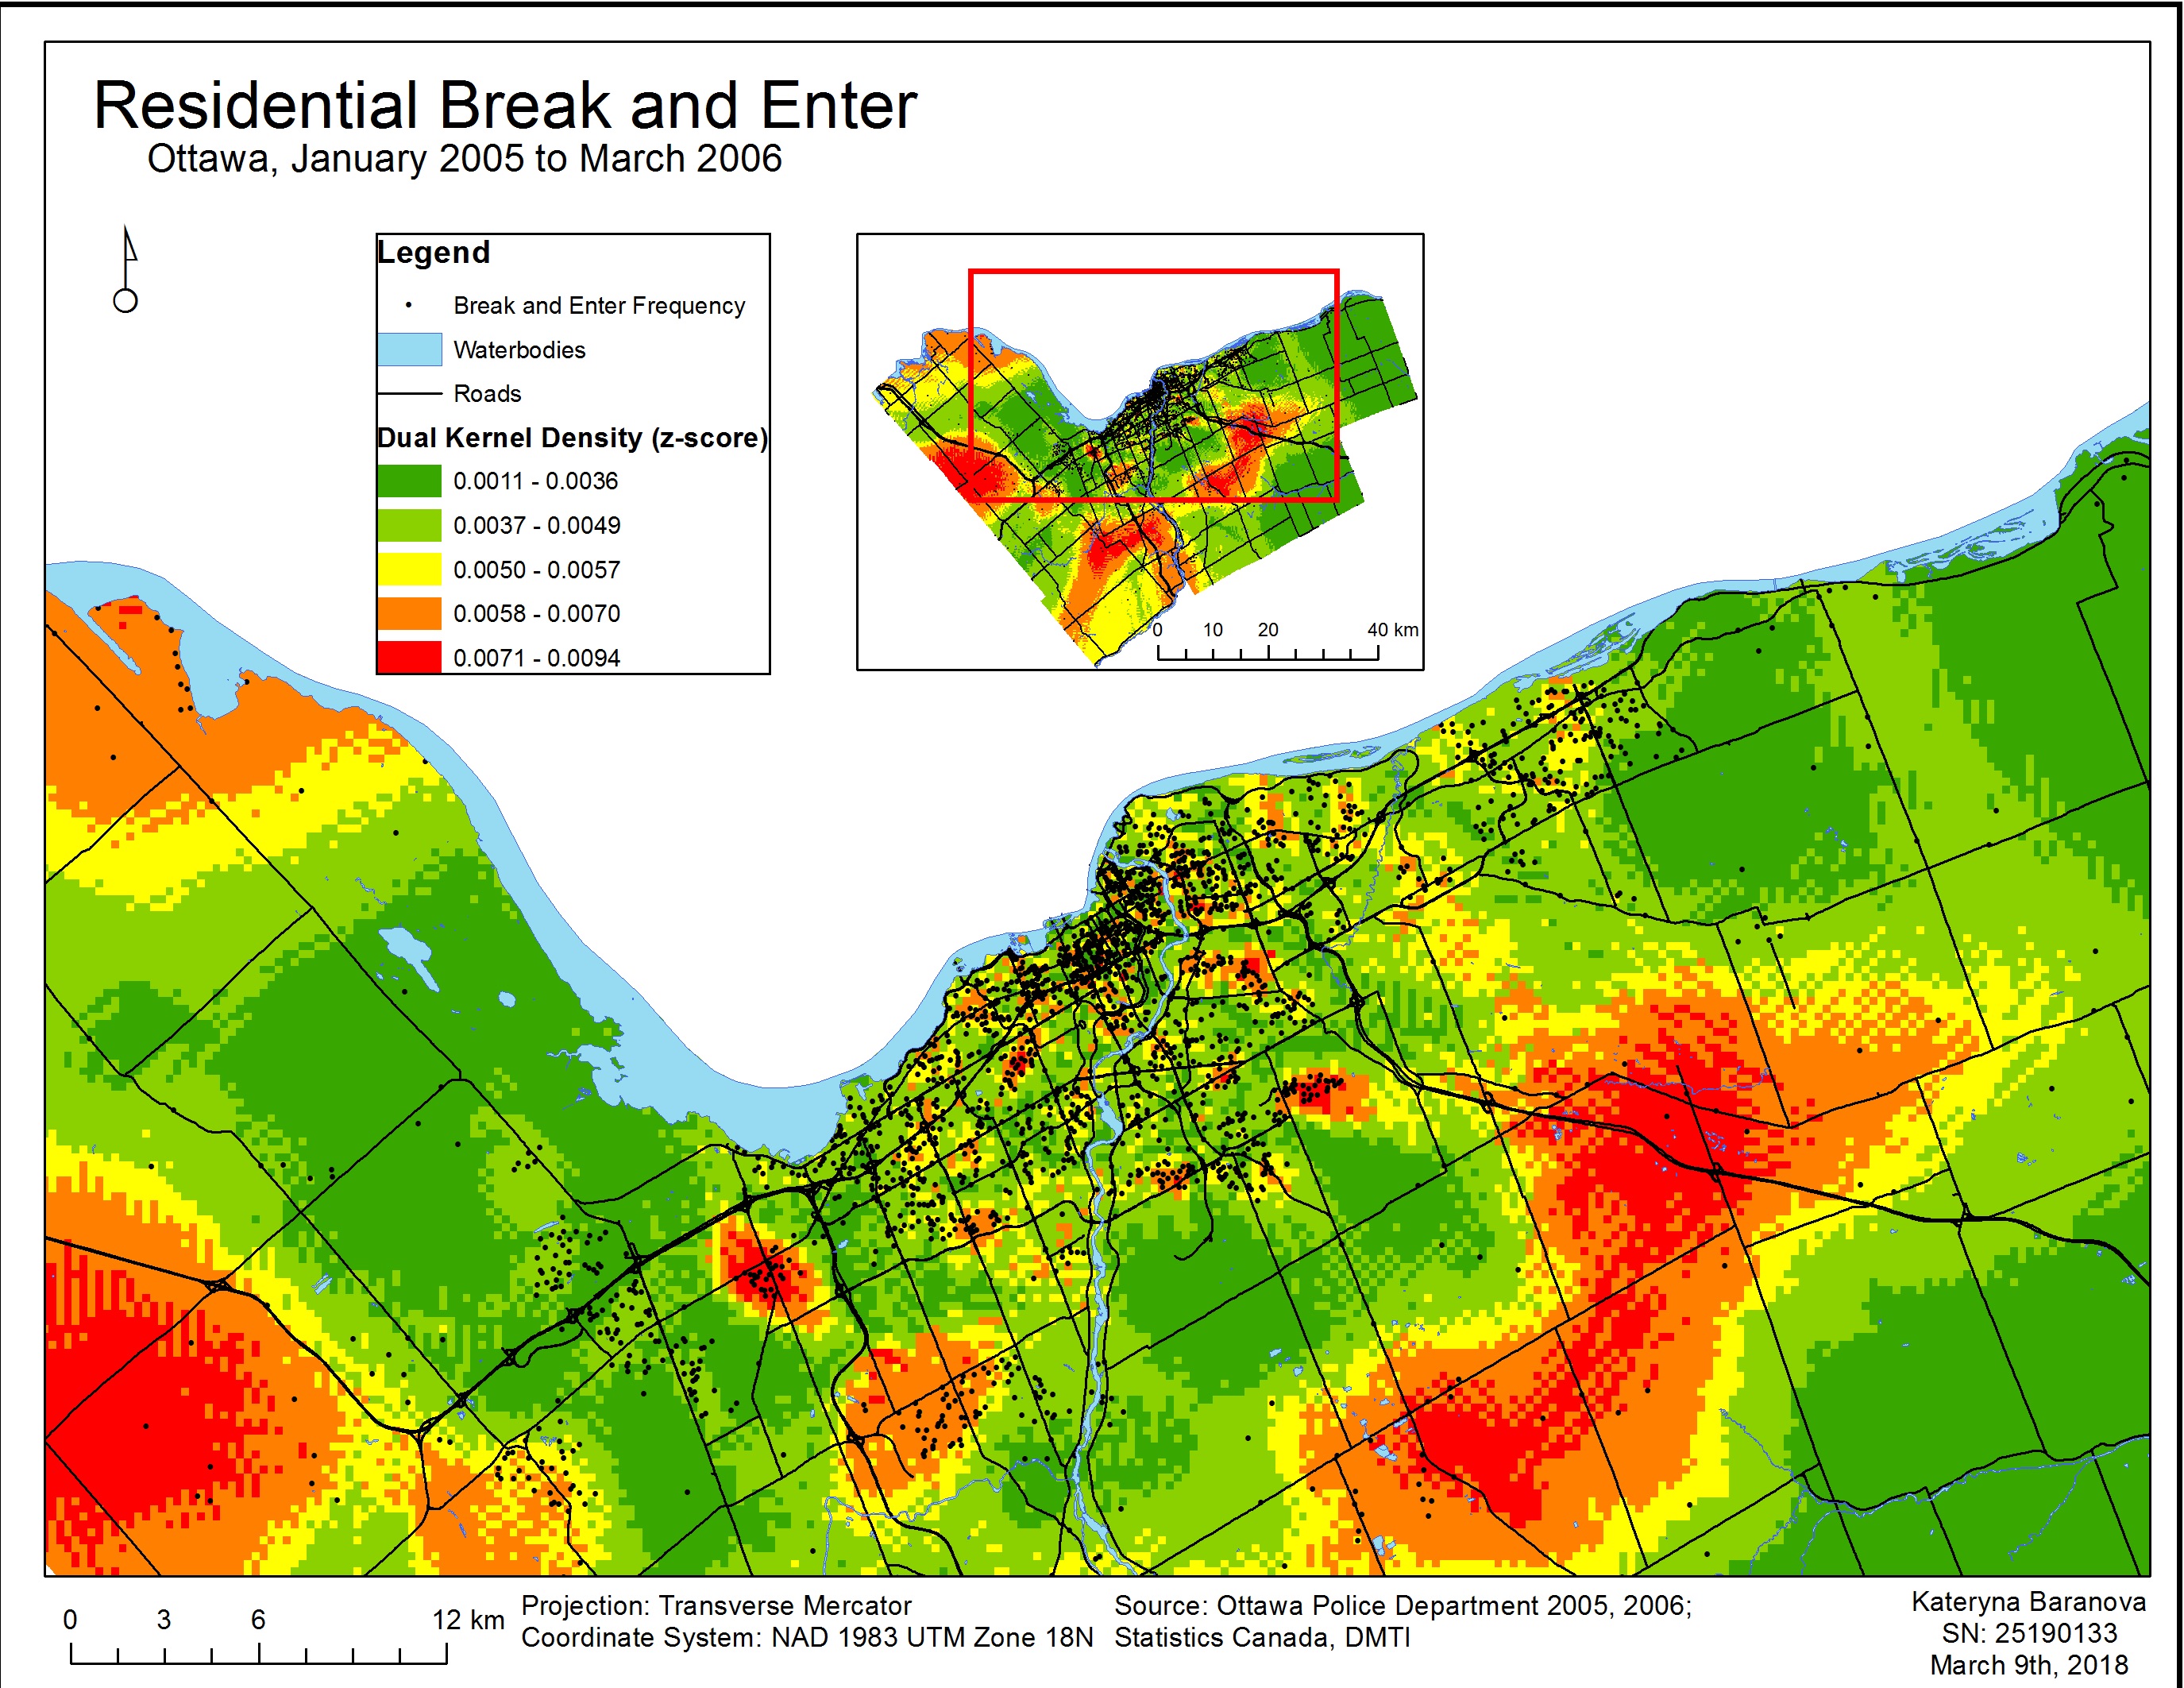
In Map 3 we can see the results of a single kernel density estimation and in Map 4 the results of a dual kernel density estimation. The single kernel density surface estimation does not account for population density whereas in the dual kernel density estimation the population 15+ is taken into account to produce a relative-risk surface. The black points represent the frequency of individual residential break and enter crimes and are overlain on the kernel density maps. Crimes are highest where the surface is red and lowest where it is green.
Map 3 of single kernel density estimation corresponds relatively closely to the risk non-adjusted near neighbour analysis clusters. Map 4 of dual kernel density estimation corresponds more closely to the first order risk-adjusted near neighbour analysis clustering results and gives a more precise estimation of relative residential break and enter risk to an individual.
Map 3. Single Kernel Density Analysis

Map 4. Dual Kernel Density Analysis

REFERENCES
Ned Levine (2015). CrimeStat: A Spatial Statistics Program for the Analysis of Crime Incident Locations (v 4.02). Ned Levine & Associates, Houston, Texas, and the National Institute of Justice, Washington, D.C. August.