Networking Assignment
The task for this week was to take a set of metadata, in this case classmates’ choices for selections on the Voyager Golden Record, and display them as a directed graph visualization using Palladio. Examining the visualizations as a graphic network makes it easier to see patterns with each vertex representing either a student or a sound selection and each edge representing a choice made.
Overall, the four most popular selections were Johnny B. Goode, Jaat Kahan Ho, Melancholy Blues, and Tchakrulo with 19, 17, 16, and 14 ties respectively. The least popular were Pygmy Girl Initiation song, Men’s House song, and the String Quartet in #3 with three each. These can be seen visually as approximations with the Size Node setting or could be looked at in Data to see the exact count for more accuracy.
One interesting way the data can be studied is through modularity, that is by the tendency of nodes to cluster and for clusters to have a higher degree of interconnectivity with each other. Using the sum of modularity setting for the class list we can see that Scott Richmond, Teagan Laverock, Anne Emberline, and Kristen McKinnock rank highest in this respect and Sarah Stephenson, Rachel Pai Chiang and Olivia Marin rank lowest. This finding means that the high interconnectivity group was disproportionately likely to share choices with other class members and the converse was true for the lowest group.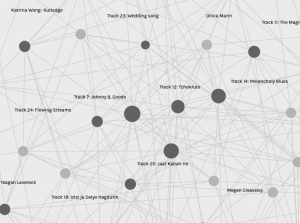
I visited the blogs of these high-interconnectivity students with the intention of comparing their lists and reading the rationale given for each choice. I was wondering if there would be any similarity in choices and in the reasons given. There was indeed significant overlap in choices, but unfortunately only a general explanatory overview was provided in most cases so it wasn’t possible to compare specific reasons. Even if it had been, this would only have been suggestive given the small sample size, the difficulty in interpreting the data, and the lack of similar information on the other classmates. As a result, there is no way to know if the high modularity was a random phenomenon or correlational.
All of us operated with basically three sets of filters when making our choices. First, the guidelines given in the assignment and dictated by the nature of the exercise, for example, inclusivity. Second, those we consciously added ourselves because we felt they were appropriate but which were not necessarily shared by other curating students, for example, in my case, an unaccompanied human voice. Third, idiosyncrasies that may have operated unconsciously, for example, a dislike of high pitches or a preference for the (un)familiar. Lacking other information, we might be tempted to speculate, for example, a quick google search on their first and surnames reveals that the four students most highly correlated with the class and with each other were all of European stock. Based on this, we might surmise that a common European cultural tradition could have influenced their choices. However, with such a small sample size and no other informative context, these observations are more likely to mislead than inform. In truth, there is no way simply by looking at the visualization to tell why these nodes are linked the way they are, or even, although I am not an expert in statistics, to be sure if the pattern is not simply happenstance.
Search algorithms on the web don’t encounter this problem because the paths that “spiders” track are weighted according to how frequently the paths are used. (NetworkConnections, 2015) If they are used repeatedly, presumably there is an explanation, although popularity can be its own reward. Recall the man in the queue who, when asked why he was there, replied that he had no idea but since there was a queue it had to be there for some good reason.
Overall, the exercise demonstrates that context is essential and that patterns may not provide useful information for researchers unless they can also be shown to be intelligible and predictable relationships.
Reference
- Systems Innovation. (2015, April 19). Network Connections. Retrieved from https://youtu.be/2iViaEAytxw