School Selection
Chicago, like most places, has school districts within which most children attend schools. However, there was more than one school within many of the Chicago district. Most districts have one school named according to the district that appears, which was the public schools. Other schools seem to specialize, many of them being called “prep” schools and charter schools. These schools likely drew students from a wide range of Chicago districts as, in many cases, they were the only one of their kind in the city. We chose to exclude them from our study on account of their lack of spatial accountability. While we felt that this was the best method for reducing errors, the eliminated schools accounted for half of the total schools. Additionally, the demographic that is being ignored here is likely not evenly dispersed through the population, somewhat skewed toward the more wealthy population who can afford to send their children to private schools. In these ways, this methodology likely resulted in a significant reduction in the reliability of our findings.
Spatial Units
As mentioned in the analysis section. There are two types of data represented in this study: school district level, and census tract level. In order to join the two datasets so that analysis could be performed, schools were plotted by district and census tracts falling into a given district were assigned statistical metrics pertaining to that school. This means that there are clusters of census tracts all over the map that have the same statistics for school data and that there are relatively sharp transitions over district boundaries for school data but not ct data. The results of this can be seen in the findings page, where the median income is plotted against the college enrollment of high school students. CTs scatter in a striated fashion across the plot, each linear striation representing a district that fell over a multitude of census tracts.
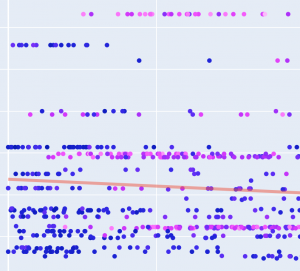
Striations resulted from school districts.
The census tracts within any given district are not necessarily very similar either, as can be seen by the linear spread of the striations representing the value attempting to explain them. The effective result is replacing every district grouping of CTs with one value representing the mean value of all of them. This results in far more coarse data and probably explains why the GWR results were stronger for CT-CT data than for school-CT data.