Results of OLS regressions in Python:
The preliminary OLS regression performed in Python took “rate of college enrollment of high school students within 16 months of graduation” as its dependent variable and “Median Income /1000”, “Proportion of population black”, “Diversity”, “Higher Education”, and “Proportion of population ESL” as independents.
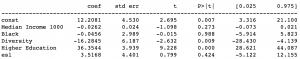
Median income did not produce a significant result globally over the city of Chicago. It was slightly negatively correlated with the rate of college enrolment by high school graduates, as seen above. The only two variables producing a globally significant correlation with college enrolment were diversity and higher education attained by the census tract population. It is interesting that median income, seeing no significance, and higher education, a very high level of significance, are strongly tied with higher education having a coefficient of determination of ~0.48 over “median income 1000” and p = 0.000.
To speak to the effect of the proportion of a census tract’s population having attained a level of education above high school on the proportion of high school grads in that area enrolling in college alone, this is a result that was expected from this analysis. In many cases, we might assume that high school students are very much a product of their surroundings. If their parents attended college or even their friend’s parents, in the mind of a high school student, that becomes the expectation of themselves and their perception of normal.
Results of Plotly graphs:
The two graphs above show the relationships between income, education and diversity within the CTs in Chicago. As a result of the joining methods conducted using ArcMap to bring together the higher education enrollment data and the CTs, you can see how the data accuracy was significantly reduced. The coarseness, in the end, joined data proved to be a major deterrent in our analysis and understanding of the connection between education rates and demographics in Chicago.
Results of ArcMap GWR analysis:
The Following geographically weighted regression attempts to find localized significance between the census tract and school-level data. Please use the sidebar on the map to toggle between explanatory variables.
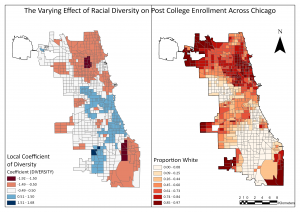
Coefficient of Census Demographics on College Enrollment:
While there were neighbourhoods that saw levels of significance, still the GWR did not provide solid evidence that any of the given variables have any significant effect one way or the other. One thing that caught our eye while running regression analyses and mapping was the dichotomous diversity effect on college enrollment.
Explaining Census Tract Variable (Higher Education) With Census Tract Variables
Due to the differing initial scales of the school level data and the census tract data, we considered relating only data of the same spatial scale. Another GWR was run where Higher education was explained by other census tract demographics: income, ESL, diversity, and proportion of the population, which is white.
Some of the dichotomous phenomena are interesting, and it was desired to look further into one of them. Below, the effect on higher education of diversity is plotted under a different classification and compared to the proportion of white residents in a CT.