It seems to be a fact the positive and causal relation between carbon emissions with the increase in global temperatures (figure 1). These increments in temperatures have a devastating impact in natural resources and the availability of them for the human being, also impacting in the frequency of extreme events like wild fires, floods, etc.
In this context carbon market based policies are a response of governments, to control greenhouse gas emissions. This policies use market mechanisms to lower emissions taxing the equivalent carbon outcome from the different types of fuels used in the economy.
In this article we discuss the carbon tax policy in the province of British Columbia, going from the origins and structure of the policy to the main results after 4 years of the implementation.
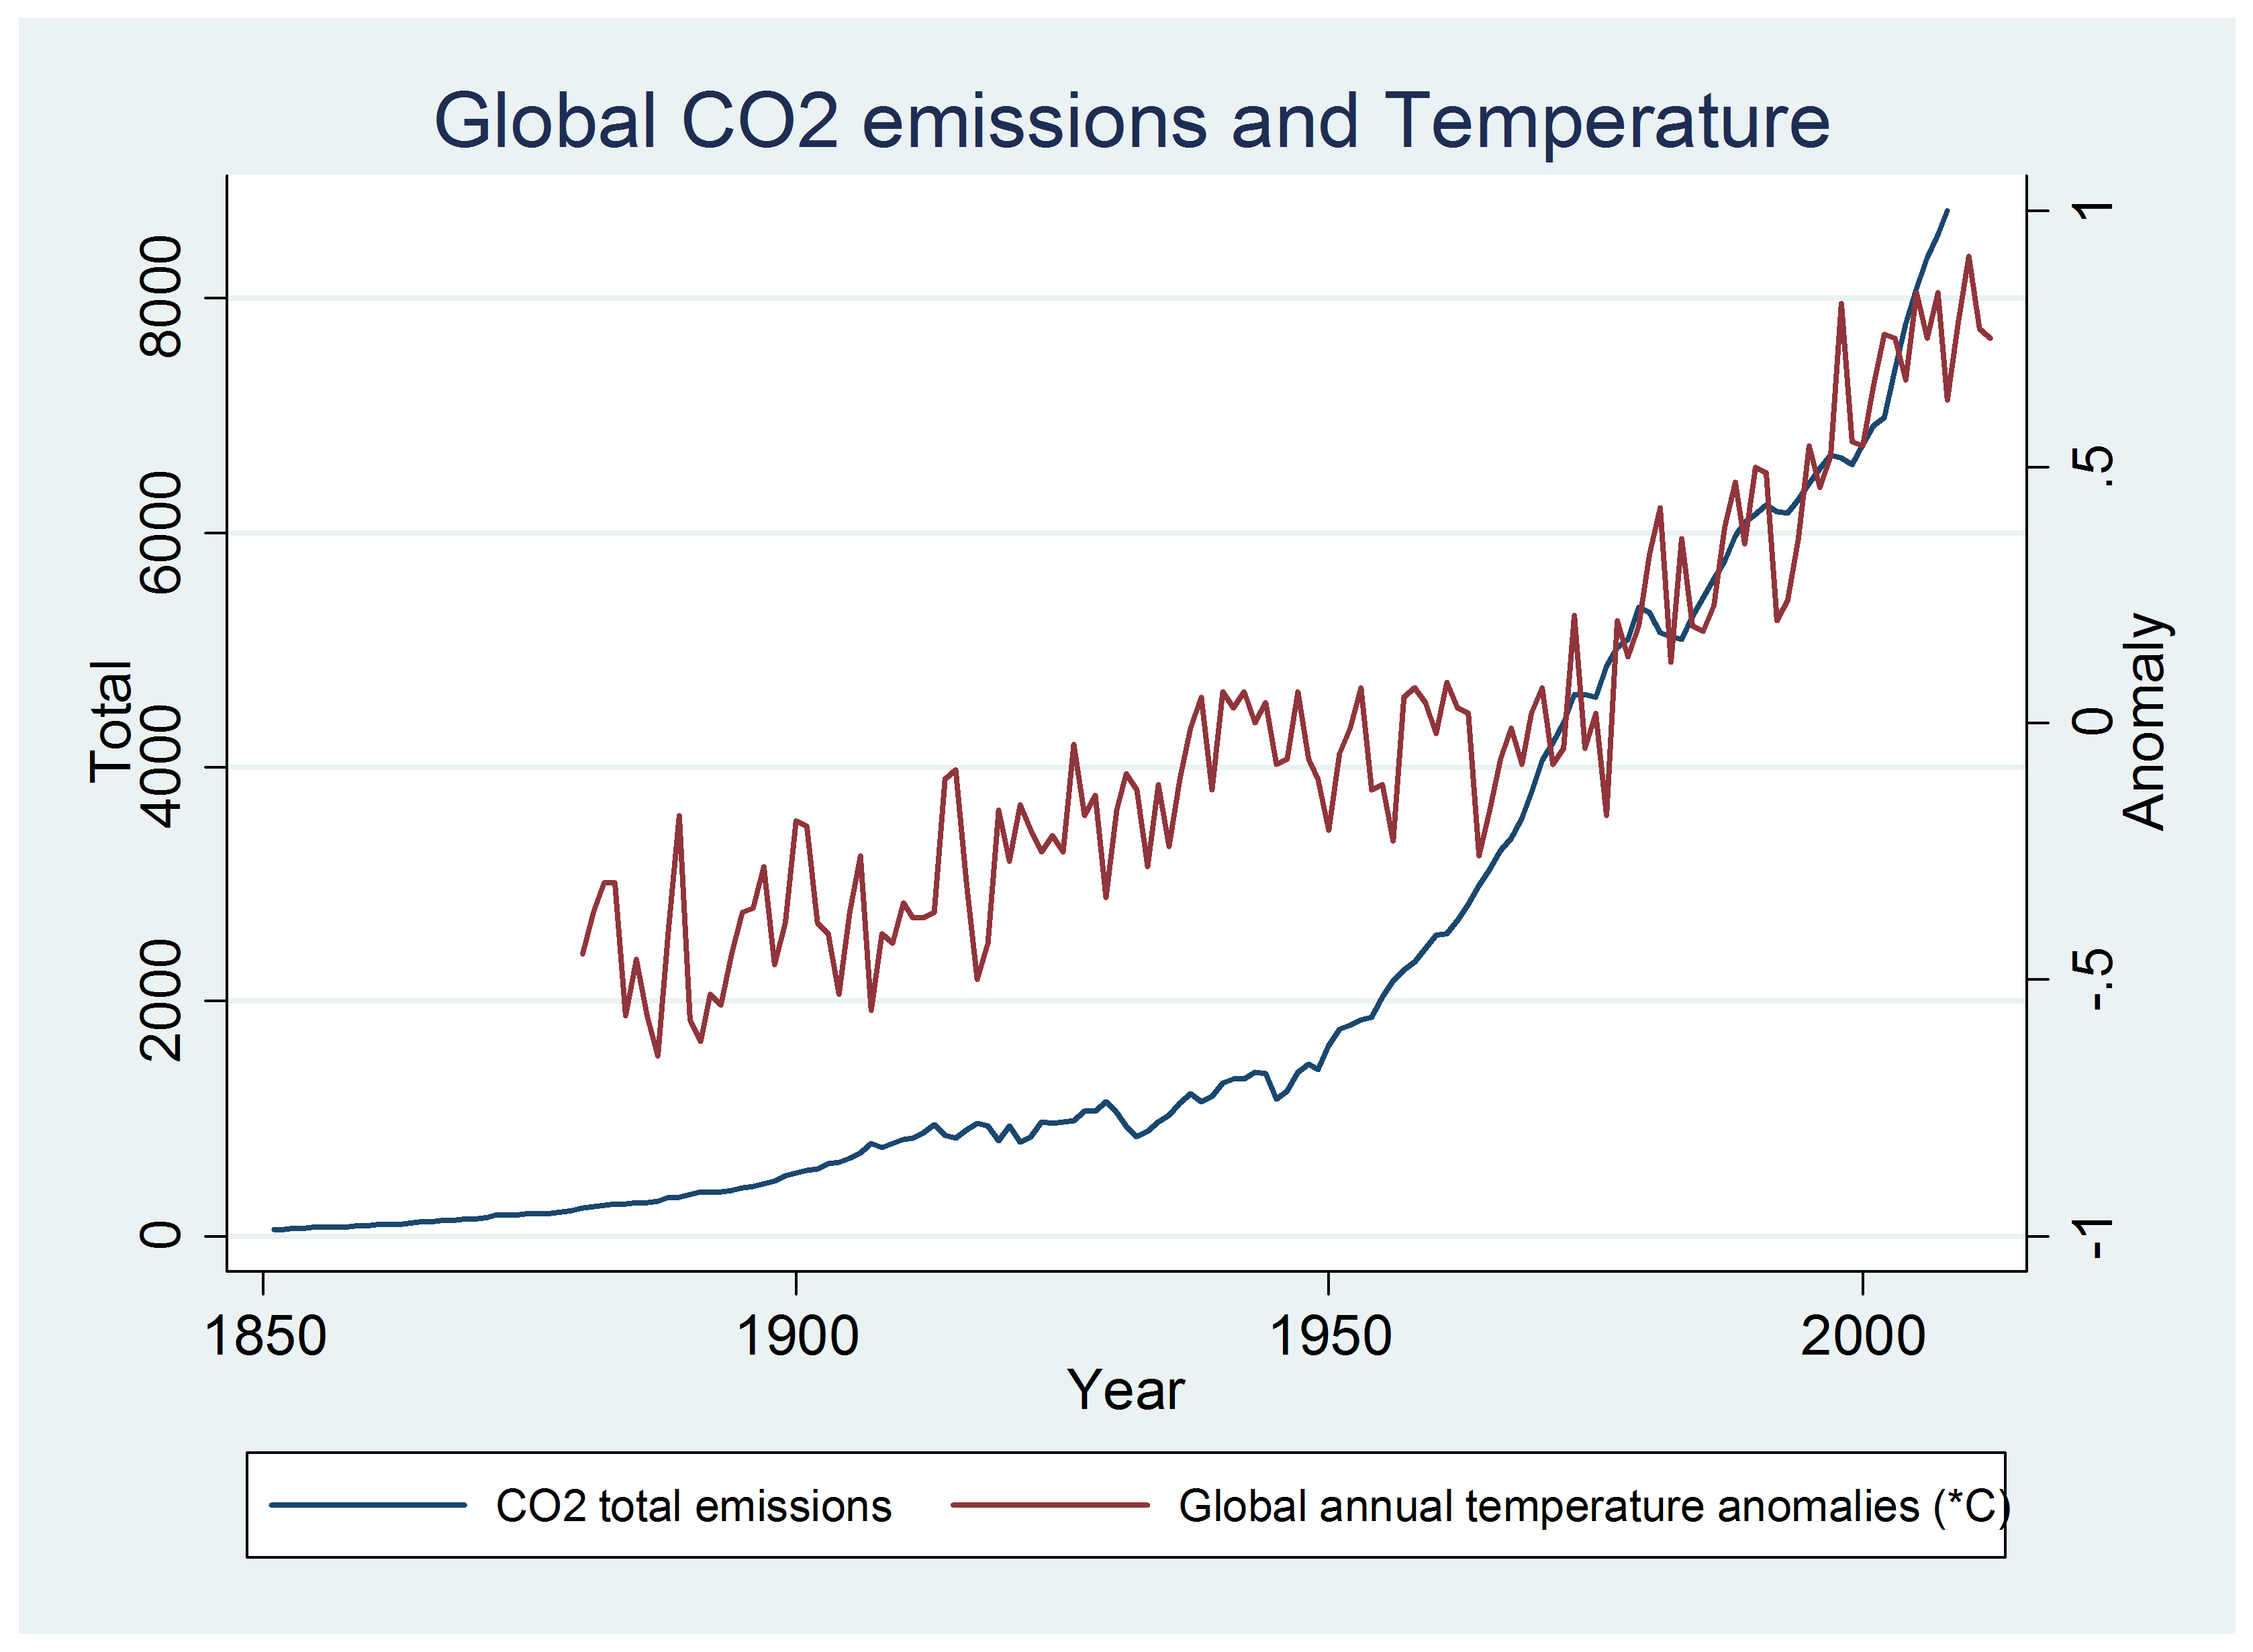
Figure 1. World emissions of CO2 and global warming.
Source : Boden, T.A., G. Marland, and R.J. Andres (2010)
Origins and goals
The carbon tax policy in BC was born as a response of increasing public interest about the themes of healthcare and economy in 2007, with emphasis in the potential damages of climate change. This cultural change gave the opportunity to introduce in 2008 the carbon tax policy, becoming BC the first North America’s revenue neutral tax reform.
The policy was structured to add more carbon taxes to fossil fuels in the specifics areas of transportation, home heating and electricity, covering almost all the fossil fuels (gasoline, diesel, natural gas and coal). Also the policy was set as “revenue neutral” which is defined as having tax cuts of value equal or greater than carbon tax revenues, and therefore reducing income taxes and tax reductions for poor households and communities (Harrison, K. 2013).
The goal of the policy is in the frame of the government’s climate policy agenda which set the commitment to reduce the province’s emissions by 33% by 2020, also that at least the 90% of the electricity consumed in the province comes from renewable resources and that new and existing production within BC would have net zero emissions by 2016 (British Columbia, 2008)
Mechanics of the policy
The tax was introduced with a rate of 10 CAD per tonne of CO2 equivalent, with an annual growth of 5 CAD per year for 4 years till reach 30 CAD in 2012. This tax applies to all greenhouse gases emitted by almost all the sources of combustion of the all fossil fuels. The tax is charged to the wholesaler, which is the responsible to pay the tax to the province, and then the tax is transmitted to the retailer and the final consumer at the point of sale (Harrison, K. 2013).
Respect to the returns of the carbon tax revenues, the initial tax cuts in 2008 included 5% reduction over 2 years in the individual income tax rate for the households earning less than about CAD 70,000 per year, and a low income tax credit as a recognition of the regressive nature of the tax. The composition of the credit is a fixed value of CAD 100 per adult and CAD 30 per child in the form of a lump sum payment.
Related income tax reduction for corporations, the set up in 2008 was between 12 to 10% over 2 years, and small business rate was the reduction from 4.5 to 2.5% over 3 years. Then in 2009 an industrial property tax credit and Northern and Rural Homeowner benefit were added to the budget. Finally in 2012 were included business tax credits for video game production, film production and scientific research, and individual tax credits for children’s fitness and seniors’ home renovations (Harrison, K. 2013).
Cost effectiveness and distributional effects
It’s not simple to isolate, weight, and compare the resultant effects that a policy have to get an exact number of the benefits of the policy specially when is interacting with many others, but in 2012, after the final incremental adjust in the carbon tax, are 4 main areas in which the results are very clear.
Petroleum fuel consumption per capita dropped by 15.1% since the carbon tax starts in 2008. Additionally BC’s consumption decline 16.4% more than the rest of Canada during the same period. These results are a remarkable effect of the policy which is resulting in a significant reduction in greenhouse emissions with a similar trend as the fuel consumption (British Columbia, 2012).
The Economic Growth of the province was unaffected and outpaced narrowly the rest of Canada. Although the carbon tax is only one piece of all the determinants of growth, there’s no evidence that this would have a negative effect in the province (British Columbia, 2012).
The revenue neutral nature of the policy which controls for no overall increase in taxation by the government it’s a successful impact of the policy. Since the beginning of the policy it has returned 318 million more in income tax cuts. This has derived in one of the lowest general corporate income tax rates in Canada (British Columbia, 2012).
Finally the decline of greenhouse emissions in per capita accounting is 9.9% between 2008 and 2010. In general BC’s reductions are 5% more than the rest of Canada.
These four areas represent the positive results in terms of costs and distributional effects of the policy.
Final thoughts
The results around the carbon tax policy in BC shows that the achievements in greenhouse gas reductions plus the remarkable level of redistribution of the tax makes it very beneficial for the province. Although there are some details that need to be corrected or taking into account when analyse this policy.
For example, the fact that BC have in average higher temperatures than the rest of Canada determines lower cost of heating. This fact makes easier for the province to reduce fuel consumptions compared with the rest of the country.
Also, the exceptions of the tax in some sectors like agriculture of fuel for aviation are not broadly analyzed in terms of the impact of have zero cost of abatement per unit of CO2 emissions. This is mainly because there are not effects to measure yet because the recent date of enactment of these exceptions. Although, in the case of aviation fuel, the consumptions does not differ from the rest of Canada (Jaccard, M., 2013)
Finally, there is an important issue about the global threat of global warming, and the necessity to coordinate efforts to control globally the greenhouse emissions. For BC, this implies standards for his inter regional trade at market level, and more globally to prevent the failure of the policy if the emissions from other regions begin to affect what the carbon tax wants to prevent.
References.
British Columbia (2008). Climate action plan. Available at: http://www.gov.bc.ca/premier/attachments/climate_action_plan.pdf
British Columbia (2012). British Columbia’s carbon tax shift: the first four years. Research Report. Available at: http://www.sustainableprosperity.ca/dl872&display
British Columbia (2013). BC’s carbon tax shift after five years: results. Research Findings. Available at: http://www.sustainableprosperity.ca/dl1026&display
Boden, T.A., G. Marland, and R.J. Andres (2010). Global, Regional, and National Fossil-Fuel CO2 Emissions. Carbon Dioxide Information Analysis Center, Oak Ridge National Laboratory, U.S. Department of Energy, Oak Ridge, Tenn., U.S.A. doi 10.3334/CDIAC/00001_V2010.
Harrison, K. (2013), The Political Economy of British Columbia’s Carbon Tax, OECD Environment Working Papers, No. 63, OECD Publishing. http://dx.doi.org/10.1787/5k3z04gkkhkg-en
Jaccard, M. (2013, July 30). British columbia’s carbon tax after five years. Retrieved from http://theenergycollective.com/markjaccard/253661/bc-s-carbon-tax-after-5-years