The final groundwater recharge map is the outcome of combining the land use and soil properties at the Salmon River watershed. The other two parameters, drainage density and slope, were not considered in this evaluation, due to imprecision in the data obtained for delineating the watershed using the digital elevation model (DEM).
The map shows the different areas of low and high recharge potentials along the Salmon River watershed. Areas with a low recharge potential are shown in red, while those in green represents areas of highest recharge potential. The figure shows a majority of poor to medium recharge potential in the area of the watershed.
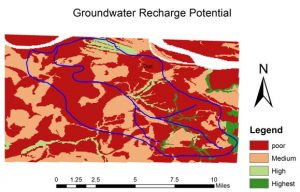
With the aim of a more precise analysis, the area of the watershed labeled in the map, was sketched based on the observed boundaries outlined in the Salmon River watershed map in the introduction section of this website.
Comparison between the GW recharge potential map and the two weighted factors, land use and soil texture.
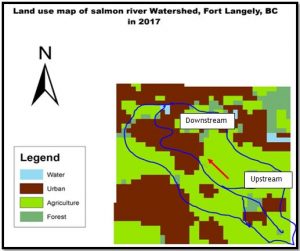
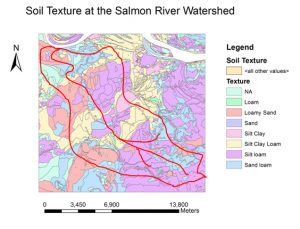
By comparing land use and soil texture from the maps below, to the recharge potential map, it is observed that areas exhibiting poor recharge potentials are areas of a growing agricultural and urban land use. These activities are expected to reduce the infiltration rates of stormwater and increase runoff. Moreover, these areas are rich in fine textures soils, indicating a low infiltration capacity. The compounded effect of these two components, is the main reason behind a reduced recharge capacity in the red areas as seen in the map.
The downstream section of the watershed, located north west of Langley Township, is dominated by urban land use as shown in figure 2, as well as a majority of sandy loam, loamy sand and sandy loam texture soil. Although, soil texture in the upstream indicates a relatively high infiltration rates, the accumulative effect of soil and urban land use resulted in a low overall recharge potential. Urban developments are associated with the creation of more impervious surfaces, common examples are roads, rooftops, walkways and parking lots. Impervious areas prevents stormwater from infiltrating into the ground.
The dominant land use in the upstream section of the watershed is agriculture. The majority of areas upstream have poor recharge potentials and small patches of medium potential. A reason for that could be the Constant tillage of soil with machinery, which causes compaction of the soil creating a hard pan that halts storm water infiltration into the soil. In these areas there is a more uptake of water by the crops and losses due to evapotranspiration of which the highest percentage is absorbed by the plants in the rooting zone and less percolates into groundwater. The soil texture in the upstream ranges between silt loam and sandy loam, silt loam has a relatively low infiltration rate than sandy loam.
The highest recharge potential is observed in areas occupied by forests, as shown in the land use map. Forest ecosystems allows for higher infiltration of storm water, the vegetation cover slows water flow and allows for higher infiltration rates.
Finally, the middle section of the watershed is occupied by an aquifer called the Hopington aquifer. This areas’ land use is divided between agriculture and urban. Referring to the change in land use in the past two years as indicated in a previous section. Urban and agriculture developments are much likely to have contributed to the decrease of the groundwater level of the Hopington aquifer as indicated by the Golder Associates (2016).