
Slope map layer
Slope map was obtained from the delineated Salmon River watershed. It was developed using the Digital Elevation Model (DEM) of Township of Langley using the Hydrology Toolset from the Spatial Analyst tool in the Arctoolbox. Delineating the DEM involved set of steps, using hydrology from Spatial Analyst Tool to find flow direction, flow accumulation, and finally clipping out the watershed area from Fort Langley DEM. The DEM of the watershed was then used to define the slope, elevation and drainage density of the watershed.
To delineate the watershed there were procedures followed as summarized below:
- The fill tool was used to fill the sinks and remove imperfections with the DEM. The DEM was used as the ‘input surface raster’ and output raster named DEM_fill
- The flow direction was thereafter conducted using the flow direction tool and the input surface raster as the DEM_fill and the output named DEM_flow. The flow directions tool helps to understand the direction of flow from each cell to its steepest down slope neighbor.
- Flow accumulation tool was then used to calculate the accumulated flow to each cell as determined by the accumulated weight of all cells that flow into each downslope cell. DEM-flow was used as the input ‘flow direction raster’ and the output accumulation raster as DEM_acc.
- The pour points were located to cells with high accumulated flow using the ‘Snap Pour Point tool’ and the input raster was DEM_acc. Pour points are points at which water flows out of the area usually the outlets.
- The watershed tool was run using the input flow direction as the DEM_flow and the input raster as the output of the pour points. The watershed raster was converted to polygon features using the ‘Raster to Polygon tool’
From the delineated watershed, the slope map was developed using the ‘slope tool’ under surface in Spatial analyst tools. The input feature was watershed DEM and output feature as slope.
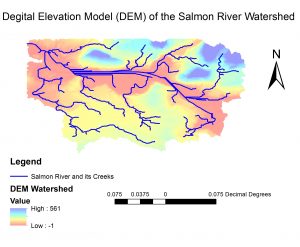
Watershed Delineation from Digital Elevation Model (DEM)
Drainage density map layer
The map layer was obtained by using the ‘focal point tool’ under Spatial Analyst tool and the input raster was the flow accumulation (DEM_acc). The extent of the area drained by the stream was assumed to be in the 50m radius for each cell and reclassification of the drainage to 2 classes (low and high). From the analysis, the areas with low density had a value of ‘0’ and areas with high density with a value of ‘859’.
Land use map layer
After clipping out the required watershed from the obtained Landsat imagery, an image classification was performed. Image classification is the process of assigning land cover classes to pixels. Land cover datasets are used to classify images into forest, urban and agriculture. The used image classification technique was supervised image classification by using the spectral signature from the training sites. The steps involved creating the training areas and the signature file was generated after which classification was done.
Within the Arcmap, tool bar was used to select supervised classification under image classification. The training sample manager was used to select the land use types in the image by selecting different pixels by drawing different polygons after then reclassified into one land use category. Maximum likelihood was done with input feature as Landsat_2007_Clip and signature file. Final land use map was developed showing the three main land use in the watershed including agriculture, urban and forestry. Fraser river couldn’t be identified in the final land use map probably because of the error in pixels in Landsat imagery.
Soil map
The soil map was developed from the geodatabase of BC soils. First the classification was done using symbology after opening the layer in the Arcmap layer outline. The Township of Langley soil types were extracted using the clip tool.