
Project Flow Chart
The flowchart below describes the process taken to achieve the objective of the project. The final groundwater potential map was developed by combining a set of thematic map layers.

Groundwater potential development flowchart
Data Sources
As shown in the flow chart, the key data requirements were the Satellite imagery, Digital Elevation Model (DEM) and the BC Soil type Geodatabase. DEM was obtained from the National Resources Canada “Geogratis” (https://www.nrcan.gc.ca/earth-sciences/geography/topographic-information/free-data-geogratis/11042). Landsat imageries were accessed from Landsat 8 and Landsat 4 data archives available at the United Geological Survey (USGS) (https://earthexplorer.usgs.gov/). These imageries were used to obtain the land use through remote sensing processes. BC Soil types Geodatabase was obtained from BC Soil Information Services (BCSIS) database available for free on their website (http://www.env.gov.bc.ca/esd/distdata/ecosystems/Soil_Data/BCSIS/).
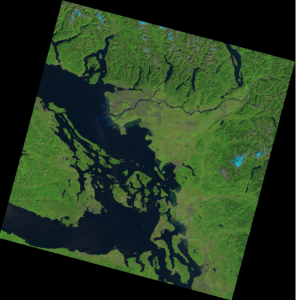
landsat 8 image year 2017
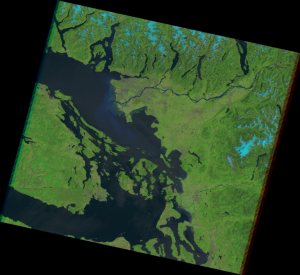
landsat 4 image year 2007