Step 1. Download ATUS-X extract
Create your ATUS-X extract from IPUMS website. Make sure to include ‘DURATION’, ‘CASEID’, ‘PERNUM’, ‘ACTIVITY’, ‘ACTLINE’ and weights variables (‘WT06’) if needed. Save .dat and .xml file, preferably in a new created ‘data’ folder.
Load extract into R using ‘ipumsr’ package.
Step 2. Download or create your own activity codes file
Create an activities code file, or you can download mine. It has to be a .csv file with 3 columns (ACTIVITY, Name, Alphabet).
- ACTIVITY is the activity code from ATUS-X, ranges from 10101 to 509999,
- Name is the name you want to give to this activity code, e.g. ‘Sleep,’ ‘Leisure,’ etc.,
- Alphabet is an alphabet letter (a to z) to code the activities.
Make sure that your number of recoded activities does not exceed the number of letters in the English alphabet (26), although potentially ASCII character set could be used.
NB: it is not recommended to have more than 12 activity re-codes because it will be difficult to find colour palettes.
Step 3. Transform your data
Using the ‘timeuse’ package (Link), contains five functions that will help you with that:
- tu_tempogram()
- tu_transitions()
- tu_totals()
- tu_maps()
- tu_path()
Each function correspond to the visualization that you want to create.
Step 4. Create the visualizations
Using one of the following packages:
- tempogram
- transitions
- totals
- usmap
- path
create your visualization. Please read the instructions on corresponding GitHub.
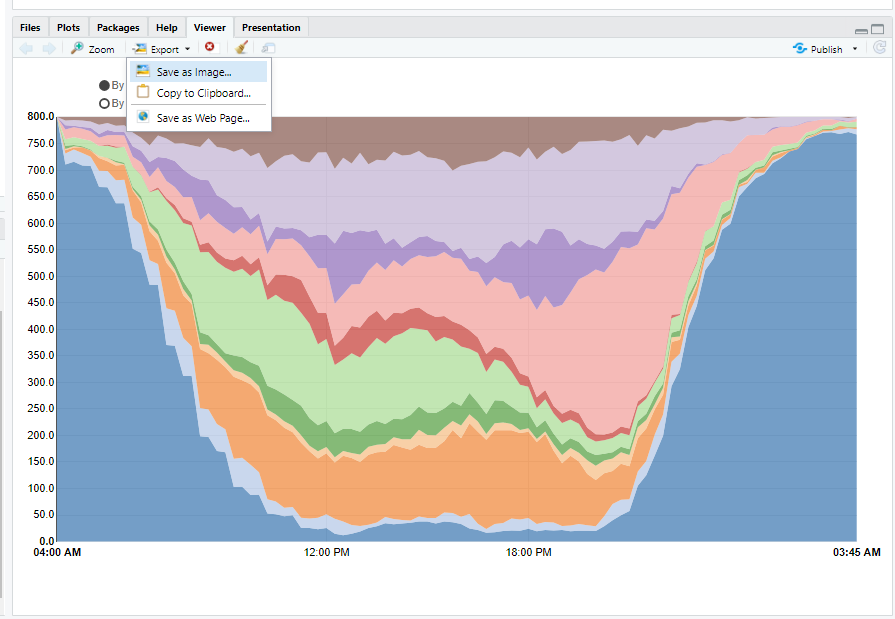
Step 5. Save your visualization as .html file
In the viewer of your RStudio, choose ‘Save as Web Page…” and save your file as ‘myfile.html’.
Step 6. Upload your html file to your GitHub page or website
If you have a GitHub.io page, upload it to your main folder, and your file will be viewable at <yourGitName>.github.io/<yourfilename>
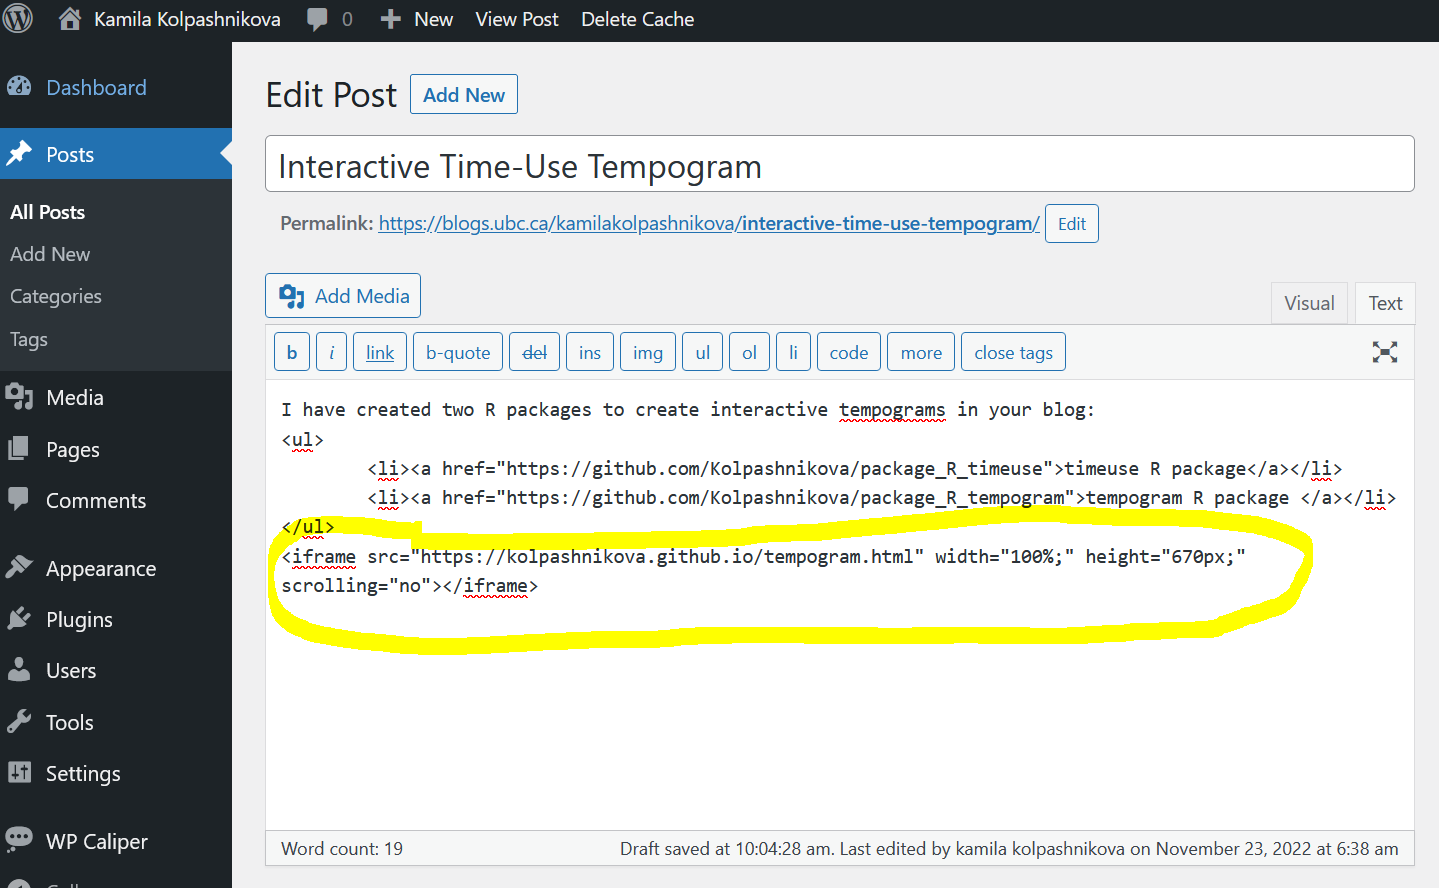
Step 7. Use <iframes> to add your visualization to your blog
For example, in WordPress you can do the following to add your graph to your blog:
Examples
These lines will create your tempogram from ‘data’ (data = ATUS-X extract).
tem <- tu_tempogram(data, w = "WT06")
tempogram(toJSON(tem)) #don't forget to use toJSON from 'jsonlite' package)
If you need to change width or height of the visualization, use these:
tempogram(toJSON(tem), width="auto", height = "550px")
kevwe Andrew ejenakevwe
November 26, 2023 — 8:09 am
Hello,
Thank you so much for the detailed explanation. After following the steps, I am stuck at the point of using the command
tu_tempogram(
df,
path_to_activity_codes = “data/ATUS_codes.csv”,
w = NULL,
granularity = “full”,
method = “first”
)
I keep getting the error below on R studio
Error in `group_by()`:
! Must group by variables found in `.data`.
✖ Column `CASEID` is not found.
Meanwhile, I am using the ATUS_code.csv file which I downloaded from the Gitshub page. In that file there is no column tagged CASEID, so I wonder if there is a mixup somewhere or it is something wrong from my end. Please kindly help