
Housing affordability
Question 5:
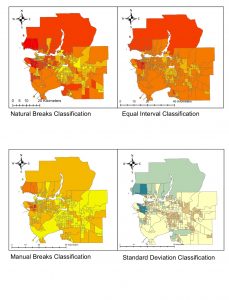
As a journalist, the classification method I would choose for my audience would be the natural breaks or the manual breaks classification. With the natural breaks classification, it would provide the natural breaks and intervals of differences in class within the housing market. By looking at the maps made, both the natural breaks and manual breaks classification provide the most equal and even distribution of class through the Lower Vancouver Mainland. As consumers are less interested in looking at the details, but more interested in paying attention towards the distribution of colours across the map, in determining whether they are willing to invest or not. If we were to choose a map with unequal distribution, such as the equal distribution classification or standard deviation classification, it would provide misleading information to buyers. As both maps project Vancouver to be affordable, with many areas falling within the lower affordability cost category, it would lead buyers to believe that Vancouver is affordable all around, which it is not. If I was a real estate agent preparing a presentation for prospective home buyers near UBC, I would use the equal interval classification as it divides the numbers equally and would assure prospective buyers of a relative safe market to invest in homes. With the equal intervals, the map projects lower numbers in cost of housing values, which can help spike the interest in prospective buyers, as well helping the real estate agent to garner more clientele. As it projects Vancouver to be very affordable, it would let buyers to garner interest in investing, believing that the prices are not high. Since the data is from 2011 and it is currently 6 years from 2017, I believe that the data shouldn’t be used since there has probably been a significant growth and differences in the data numbers. With housing costs increasing and decreasing each year exponentially in Vancouver, the data collected from 6 years ago most likely has changed significantly with the current data of housing costs.
What is affordability measuring, and why is it a better indicator of housing affordability than housing cost alone?
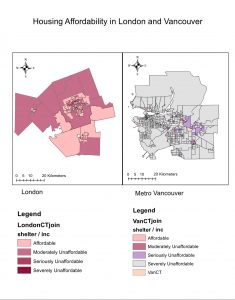
The following two maps of London and Vancouver project the housing affordability within the city. The projection of affordability is shown by the median housing cost divided by the median family income within the city.
What are the housing affordability rating categories? Who determined them and are they to be ‘trusted’? (You have seen in the previous map how different classification breaks produce very different visual impressions).
In measuring housing affordability, the rating categories that describe the affordability are the following:
Affordable (median multiple of 3.0 or under)
Moderately Unaffordable (median multiple of 3.1-4.0)
Seriously Unaffordable (median multiple of 4.1-5.0)
Severely Unaffordable (median multiple of 5.1 or over)
These following categories have been determined and classified by Demographia, within their International Housing Affordability Survey 2017. The company every year surveys 9 countries being Australia, Canada, United States, Hong Kong, Ireland, Japan, New Zealand, United Kingdom and Singapore. Through the Demographia International Housing Affordability Survey, they calculate income-based affordability using “Median Multiples”, which is the median housing cost divided by the median housing income. The idea of calculating affordability using the Median Multiple has been recommended by the United Nations as well as the World Bank. While the ranking and determination of affordability can be trusted, the Demographia Survey also fails to address other countries, by limiting itself to only 9 countries. Also, it fails to consider transportation costs within its calculation of affordability. While a housing unit within an area may be affordable, high transportation costs can also deter the housing unit to become unaffordable.
Is affordability a good indicator of a city’s ‘livability’?
Affordability is a good indicator of a city’s livability. With the idea of affordability being determined through median housing costs divided by the median family income within the Lower Mainland, it can provide information on where families and buyers can invest in based on their current incomes. Although Vancouver’s affordability is definitely not ideal, as less income deters less income going towards leisure activities to be done, it is only a single factor. Based off The Economist, Vancouver has been ranked third for the most livable city in the world. Despite housing being unaffordable, such factors as stability, healthcare, environment and culture, education and infrastructure have been considered and lead Vancouver to become one of the top ranked cities to live in.
Accomplishment Statement:
Learned how to manipulate the visual outlook of maps with the usage of different break classification methods on ArcGIS.