Author Archives: kakepetj
Patagonia Part 1
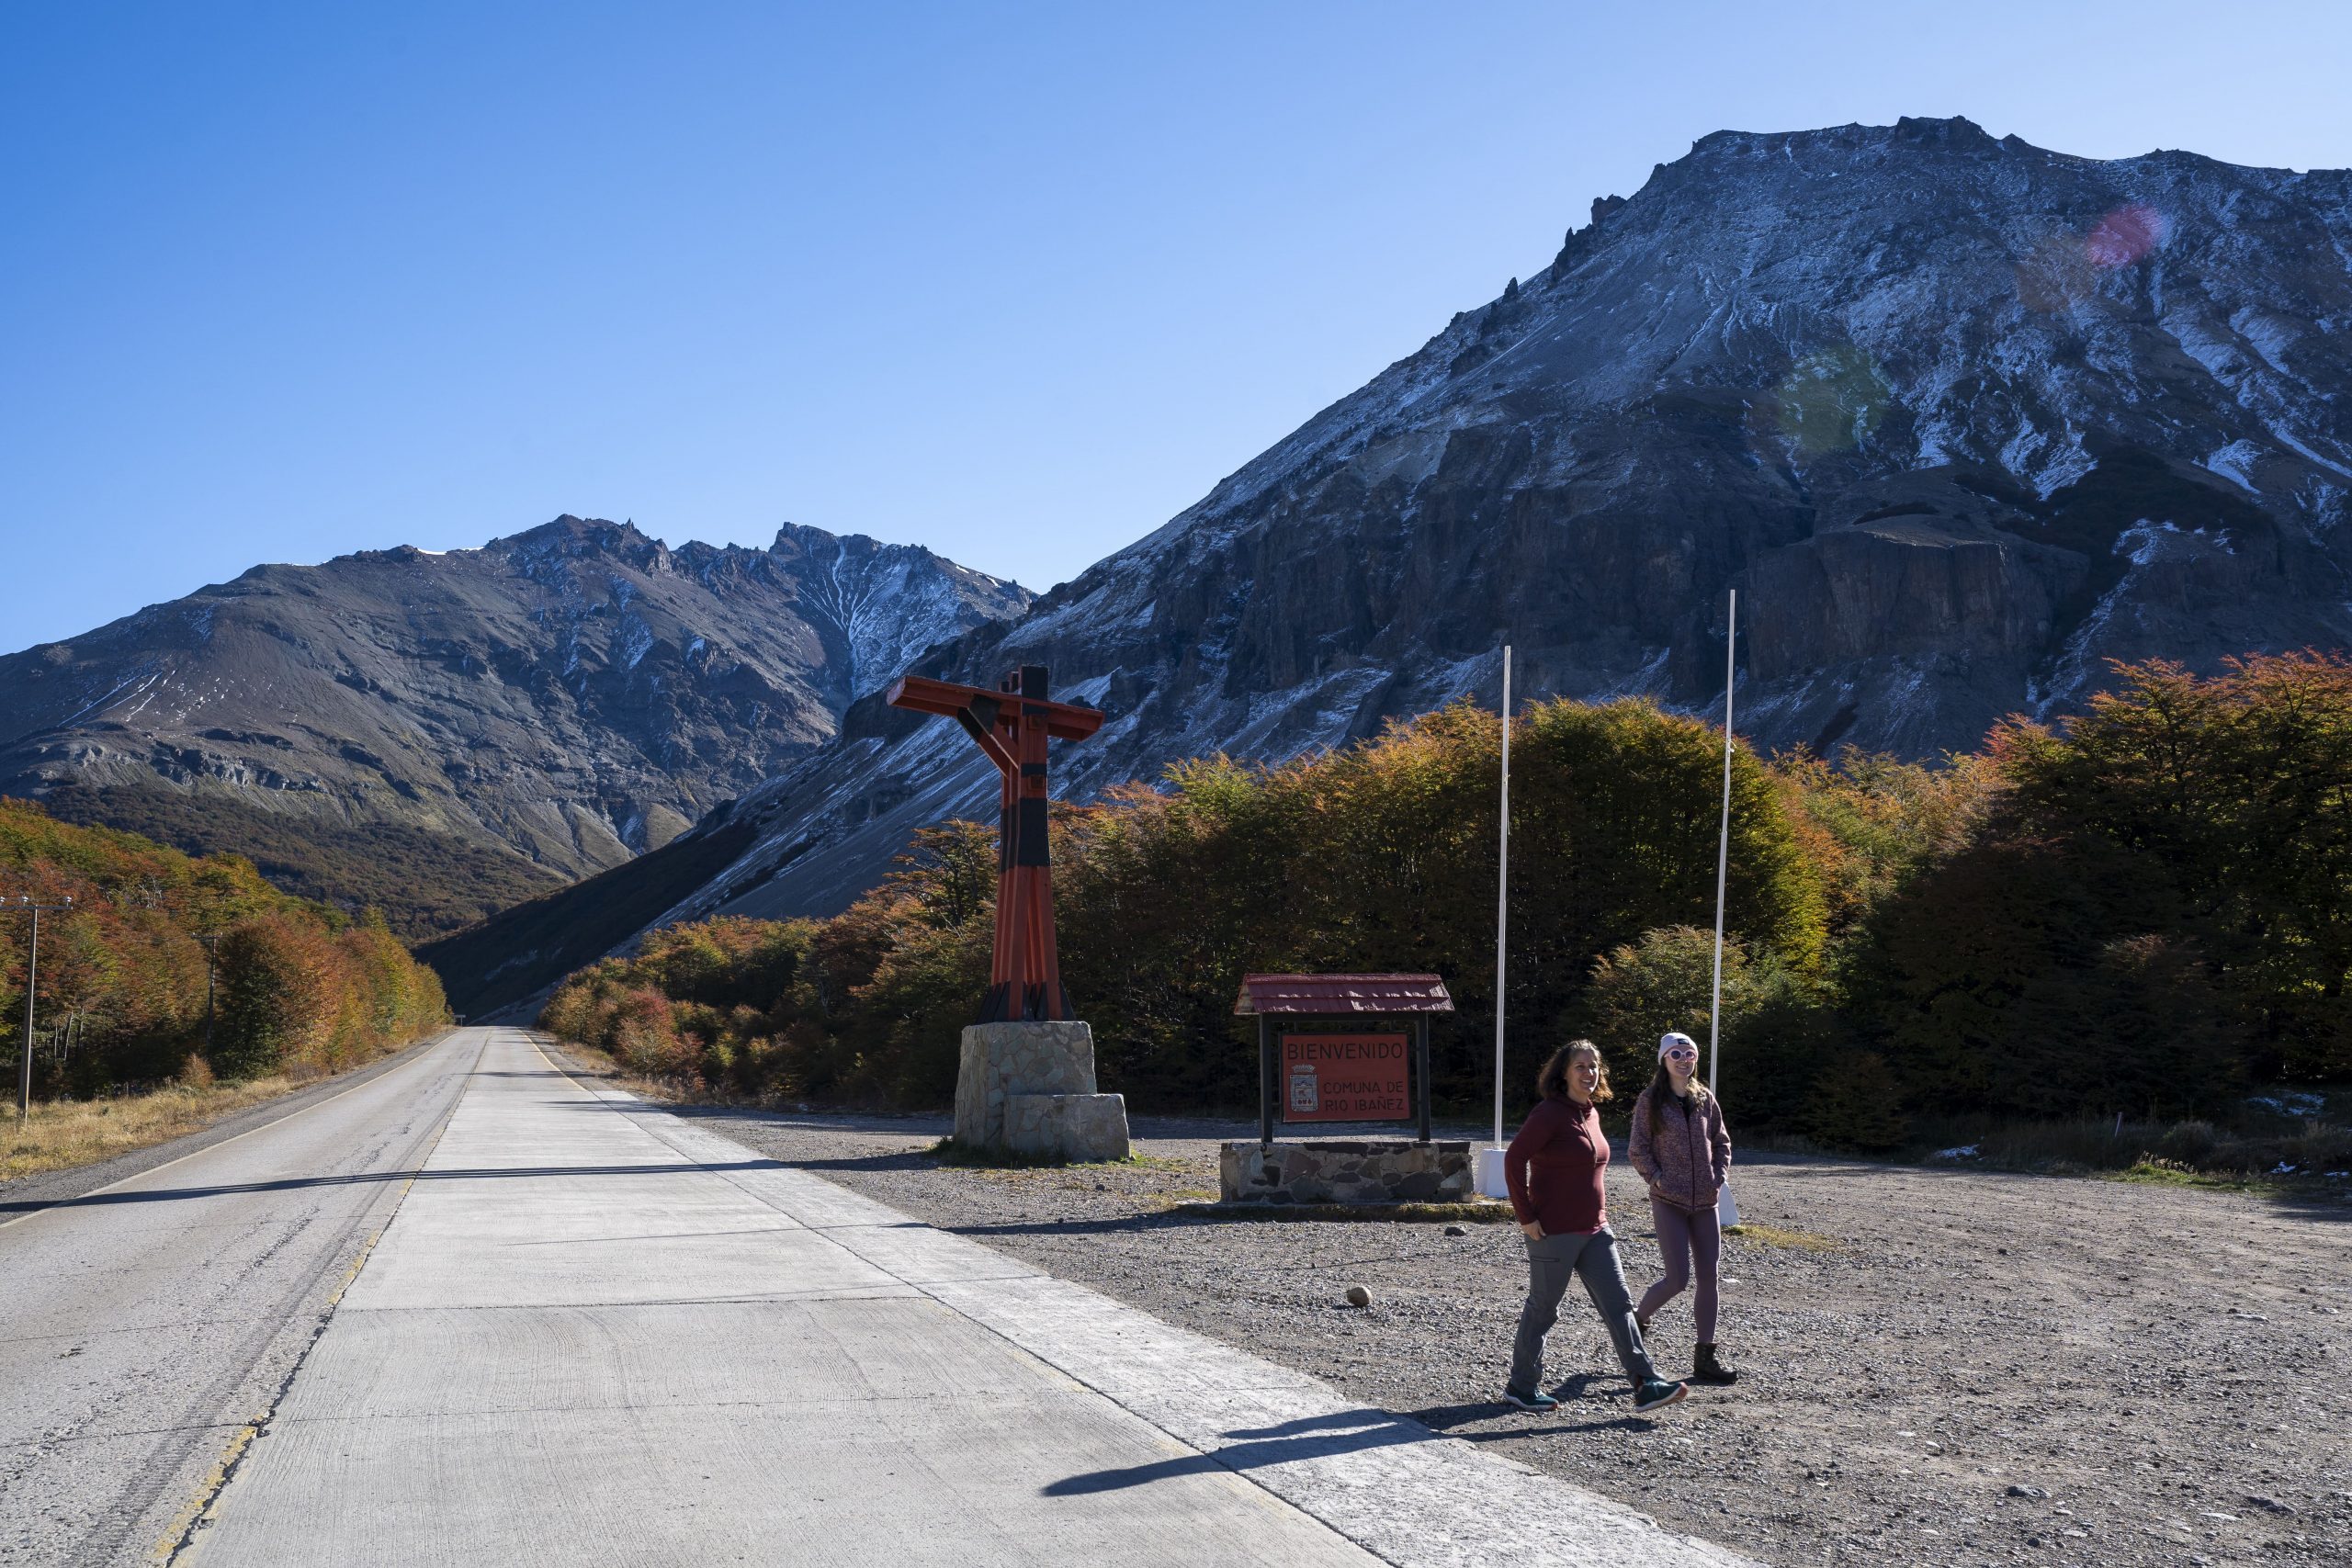
For the month of April, Michele and I embarked on an unforgettable journey across Chile, travelling from Santiago to Villa O’Higgins along the winding mountain highway of the iconic Carretera Austral. Our goal was simple, to share the outputs of my PhD project which sought to understand the Controls on the dynamics of Catastrophic Mass Movements in High Mountain Regions. I had spent four years researching how Villa Santa Lucia and Villa O’Higgins were being affected by climate change, deglaciation, and catastrophic mass movements. We wanted to meet with communities who are being affected by these complex landscape dynamics and establish relationships for future collaboration surrounding holistic hazard management in remote mountain settlements. Nestled between towering mountains and glacial rivers, Villa O’Higgins became our home base for an intensive field expedition across the Mosco watershed.
During the first two years of my PhD, I had researched the impact of climate change on the Mosco glacier range and had planned four field visits to characterise the role of deglaciation in increasing the frequency of CMM, and to determine the stability of two new glacier lakes which had formed in the paraglacial landscape. These four trips were ultimately cancelled due to Covid-19, and so the opportunity to finally visit O’Higgins was a long-awaited and emotional way to end my PhD journey.

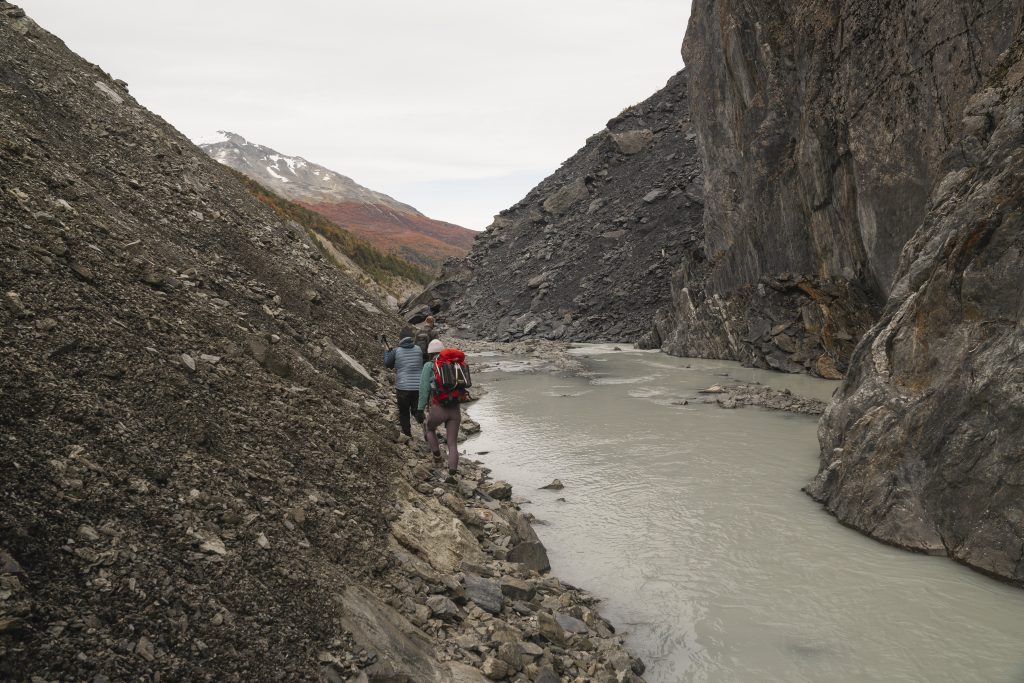
Over the course of my PhD, I had been in contact with Martin, a local community member who manages the Mosco Hostel. Martin has lived in O’Higgins for seven years, observing the changes in the landscape caused by flooding and deglaciation, and had twice before visited the Mosco glaciers. Generous with his knowledge and expertise, we spent the first evening in Villa O’Higgins planning the route to the Mosco glacier lakes. We learned that we had to navigate through a treacherous canyon which could be impassable due to the rapidly flowing and endlessly evolving Mosco River. The constant threat of landslides and debris flows from the surrounding mountains would also cast a shadow over our trek.

Setting out the next day, we hiked 10km of winding forest and set up camp at a refugio (shephards hut) around 5km from the lakes. Ditching our heavy packs, we went to scout the Mosco River and planned our route for crossing the sinuous channels leading up to the canyon. We camped out at the refugio, and early the following day, we began our journey to the lakes. Early mornings provide cooler temperatures, which in theory meant lower glacial melt and lower discharge in the Mosco River. In a perfect world, it would be flowing underground, making the canyon more easily accessible. This was not the case.
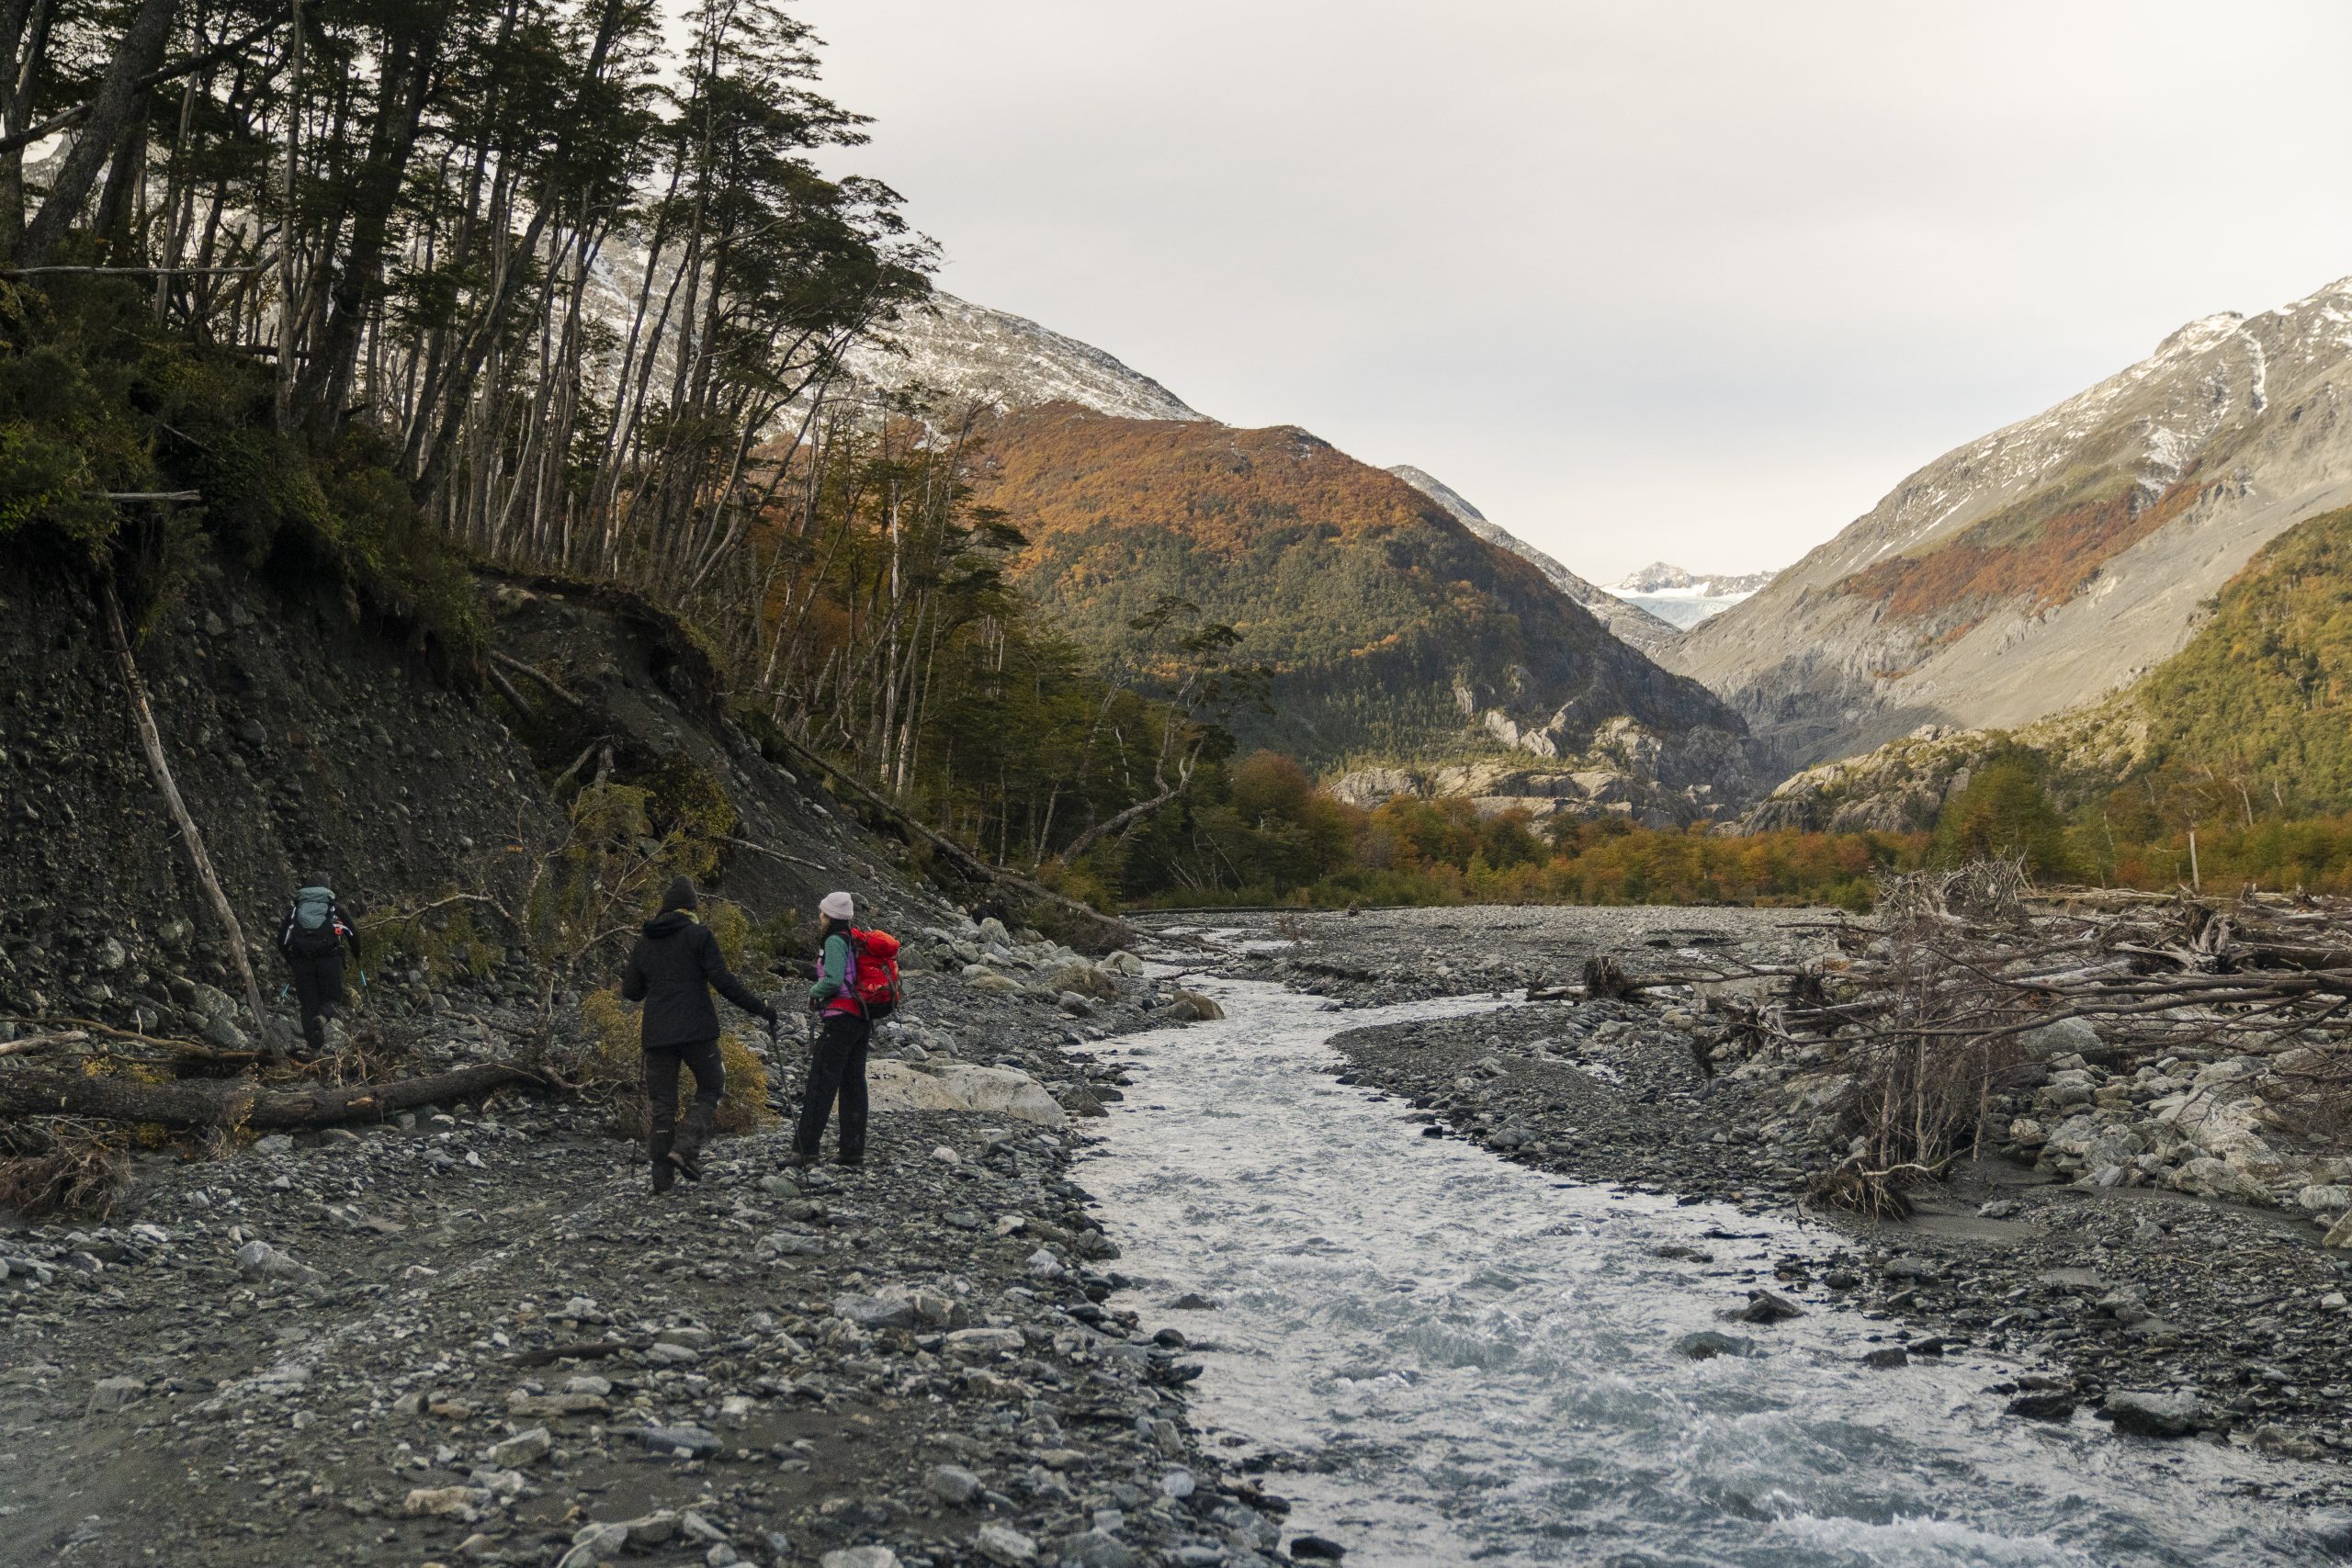
Mosco was flowing rapidly, but we crossed twice with relative ease. Moving rapidly across the alluvial fan, created by frequent landslides and debris flows running down from the surrounding mountains, we checked the first two trail cameras which had been installed by my PhD supervisor Professor Andy Russell and Dr Alejandro Dussaillant in 2021. To our surprise, these cameras were both operational, and provided two years of time lapse imagery of the landslide which created the first glacier lake. The trail cameras also yielded enormous spiders hiding in the cases secured to trees, and terror in me.
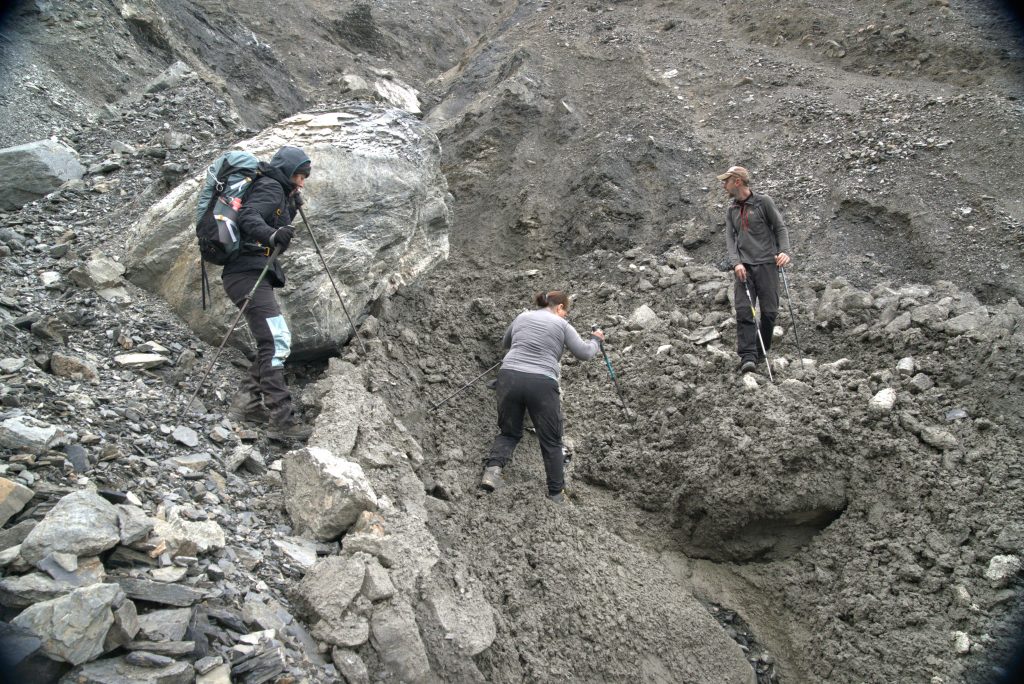
Continuing towards the lakes, we encountered fresh debris flow tracks which were likely triggered by recent rainfall. Another reminder of the dynamic landscape we were passing through, and a reminder to be vigilant about safety. We arrived at the mouth of the lake, and walked single file around its border. With every step, scree slipped and shifted beneath us, falling into the lake. As I walked forwards, I hoped that the large boulders balanced on the scree above us wouldn’t fall. They didn’t; we arrived safely on the side of the lake and began our work. Michele deployed hobo loggers, which would monitor the glacier lake level and temperature for the next 12 months. I flew the UAV, imaging the glaciers, lakes, mountain sides, and the headscarps of generations of slope failures. I would create 3D renderings of the area, using Agisoft photogrammetry software to build digital elevation models (DEM) based on the image X,Y, and Z coordinates. This DEM would be used in scenario modelling of potential inundation extents of CMM and flood events, and will also be used to quantify the changes in glacier volume, extent, as well as the size and volume of future CMM occurring across the Mosco watershed.
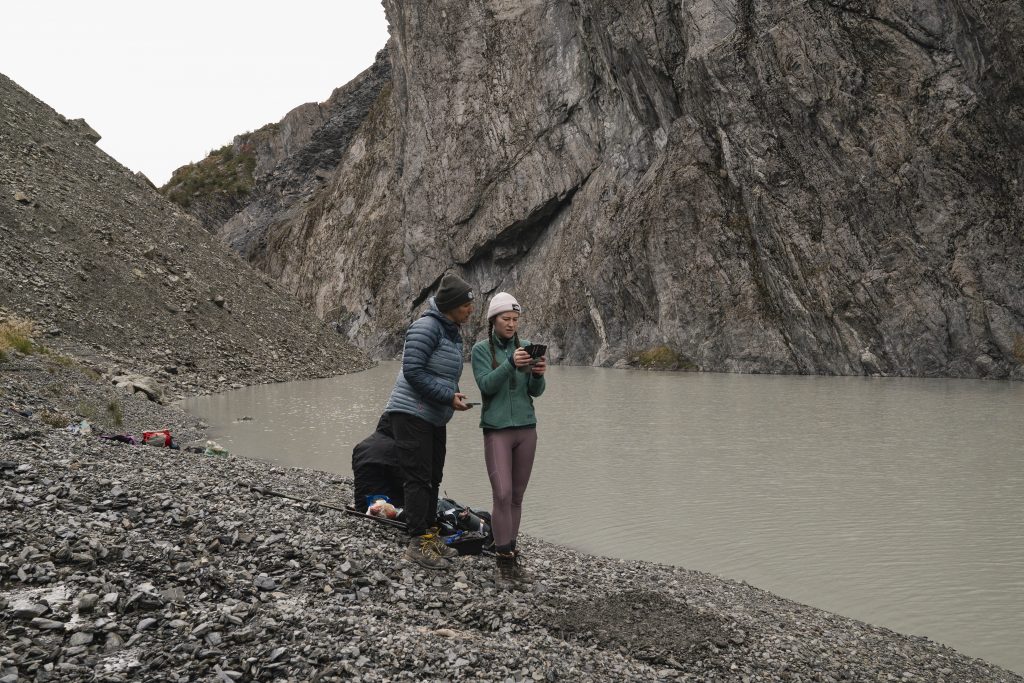
After we finished installing our monitoring equipment and surveying the glaciers, lakes and landslide deposits, we retraced our steps and left the treacherous canyon, reaching the alluvial fan and completed another UAV survey of the unstable mountain slopes surrounding the fan. Michele gathered sound recordings of the glacier streams and the sediments moving within the streams, and I took some time to speak to our guide Martin about the changes he observed in the valley since his last visit to the glacier in 2019. Tired but invigorated by the success of the day, we trekked back to Villa O’Higgins.
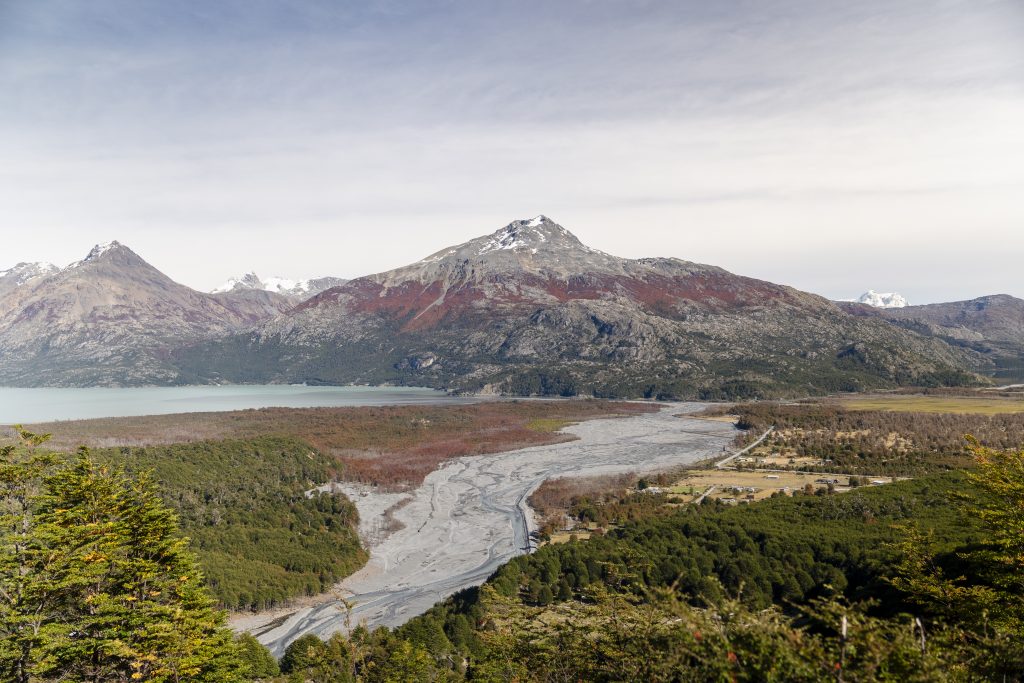
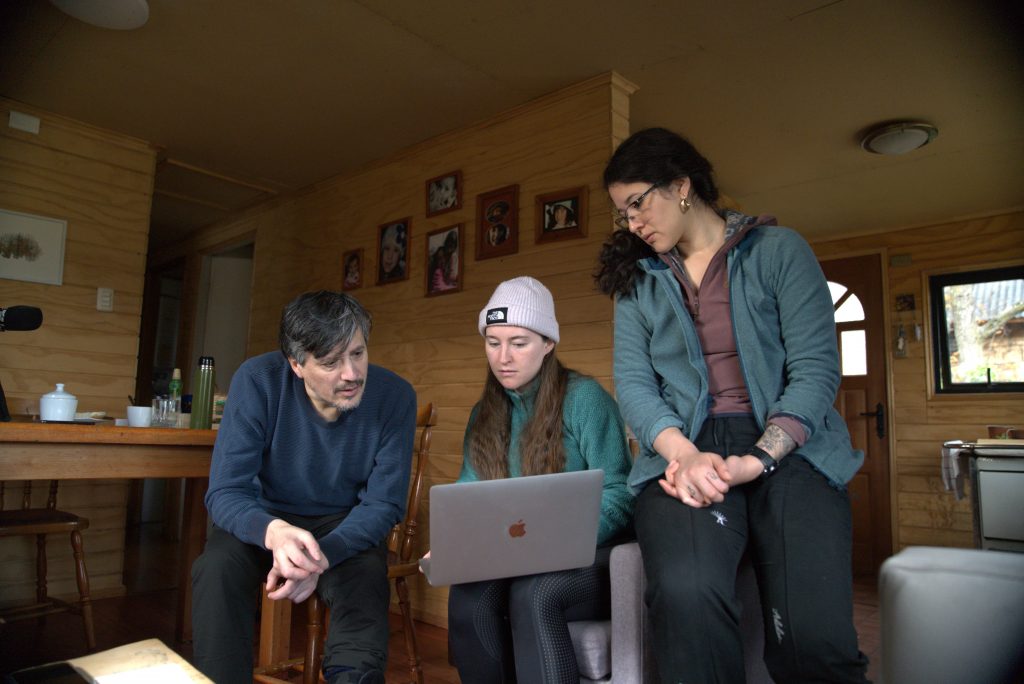
The following days in Villa O’Higgins were spent interviewing community members; three people generously gave us their time to share stories of landscape change over the course of their lives. Andrea and I delivered a presentation about my work to 30 community members, where we spoke about the changes in the glaciers, landslide histories, and future potential hazards which may impact the community. During a lively Question and Answer session, we learned about the concerns of flooding and future landslides which could impact people, houses, and future infrastructure development. We came to understand that the community concerned about the efficacy of new flood defenses which border the Mosco river. These flood walls were built by the municipality in response to an atmospheric river induced flooding event in 2019, which destroyed bridges, inundated homes, and caused two community members to permanently relocate to the other side of the river. We were encouraged that all attendees of the event thought more monitoring and research around the Mosco watershed is needed, that they want to be involved in the management of the watershed, being supportive of co-developing hazard management strategies during future visits. The community also expressed that scenario-based modelling of future flood and mass movement inundation is a priority for them, and they would welcome our support in generating this information.

We left Villa O’Higgins after six days of learning, observing, and acquiring data. Ready for the next part of our journey, we returned to the Carretera, heading North to Villa Santa Lucia.
Living with landslides in Patagonia

Exploring communities in the path of landslide hazards in Chilean Patagonia, April 2024
The impact of recent climate change on the evolution of Bridge Glacier- 2021 Field Season
Introduction
This is the third of a three-part blog series examining the impact of climate change on the evolution of Bridge Glacier. In the first post, we established that since the end of the Little Ice Age, Bridge Glacier has been steadily retreating, and the rate of retreat has intensified exponentially over the last 70 years. In the second, we took a closer look at what has been happening at Bridge Glacier over the last ten years, learning that both the calving rate and calving contribution to total melt and discharge from the lake at Bridge Glacier have been altered by climate-induced retreat of the glacier. In part three we will be looking at current activities at Bridge Glacier and their utility in better understanding the hydrological, and morphological changes at the glacier site as well as the future of Bridge glacier and its downstream communities.
Summary of the 2021 Field Season
The Climate and Cryosphere Lab’s 2021 field season consisted of two trips, the first on July 10- 15 and the second on September 11-15. The July trip consisted of placing two time-lapse cameras, one with full view of the calving front, and the other with a view of the stream flow into the lake on the land terminating side in order to observe changes in streamflow over the summer. In addition, six ‘RaspberryShake’ seismometers were placed at various points along the glacier as an experimental technique used to assess the sediment movement from the sub-surface of the glacier along with taking multiple acoustic hydrophone recordings of the water flowing from the glacier. Three dilution gauging tests were completed at the stream at the edge of the grounded terminus of the glacier to assess the flows. The September trip consisted of collecting the time-lapse cameras and seismometers as well as completing a Ground Penetrating Radar (GPR) of a transect of Bridge Glacier in order to assess the current thickness. Two additional stream dilution tests were also completed in order to gain insight into the seasonal streamflow changes.

Seismometer Installation
It has been established that as Bridge Glacier and numerous other glaciers in its vicinity retreat there will be hydrological consequences. But what hasn’t been discussed as much is understanding the changes in sediment output from the glacier and its impact on downstream communities. The mechanisms governing how sediment is released from retreating glaciers, for the most part, are poorly understood (Beaud et al., 2014 ). Seismometers were installed as a potential way to quantify this sediment transport. Seismic waves are propagated through Earth’s material due to generated elastic energy due to an applied force (Oldenburg et al., 2017). In this case, the sediment movement below the glacier was hypothesized to create the described energy impulse.

The technique consisted of placing seismometers at various distances from the glacier in order to profile how sediment is moving. This is currently the only way to quantitatively hypothesize how sediment is being transported below the glacier (Beaud et al. 2014; Beaud et al., 2018a; Beaud et al., 2018b; Delaney et al., 2017; Glasser & Bennett, 2004). The quantity, size, and speed of the sediment can be correlated with the seismic signal (Bartholomaus et al., 2015; Gimbert et al., 2016; Vore et al., 2019). Seismic data was successfully collected from five of the six seismometers and is currently being processed and analyzed to better understand how the glacier’s retreat is directly related to changes in sediment flux.
Time-Lapse Cameras
The time-lapse cameras were placed with a view of the calving front and the second placed in front of the glacial stream. This was done in order to assess how both the calving front and stream changed from July-September. The consistent loss of ice from the calving front can be observed throughout the summer along with the drop in the streamflow. The temperatures during this July time period were unseasonably warm which likely contributed to the high stream flow.
Dilution Gauging
Salt dilution gauging was completed during both trips in order to assess flow in the glacial stream and how this progressively changed seasonally and daily. This was accomplished using a salt injection method. 2kg of salt was injected upstream and two “Quik Quak conductivity probes” were placed in the stream to measure the change in conductivity as the salt was transported downstream. The depth of the stream was estimated using a water level logger. With this information, the change in conductivity over time and the profile of the stream bed could be integrated to calculate the flow. This was done at 8:00, 12:00, and 16:00 during a single day on the July trip and around 10:00 and 12:00 on two separate days of the September trip. The data from the dilution gauging is still being processed in order to better conceptualized flow throughout the summer.
Acoustic Recording
Recordings using a hydrophone were taken while installing the seismometers. These recordings were recently used as part of Michelle Koppes’ and Susie Ibara’s exhibitions at the TED Countdown conference in Edinburgh in October 2021. Recordings will also likely be paired with the seismic data during the same time frame to better conceptualize how sediment flux is changing with flows.
Ground Penetrating Radar
Ground Penetrating Radar (GPR) was used to access the thickness of a transect of Bridge Glacier. This was done during the September trip using a ‘PulseEkko GPR’ mounted on skis so it could be dragged along a transect of the glacier. GPR uses an oscillating radio wave pulse that penetrates through the ice but is reflected off of the bedrock surface. This occurs because ice has a relatively low dielectric permittivity (ε-the polarization of material due to an applied electric field). This means that the radio wave is more easily transmitted compared to the rocky surface where the relatively higher dielectric permittivity causes the wave to be reflected back up to the surface (Oldenburg et al., 2017). Based on the return of the reflected waves to the surface the thickness of the ice can be estimated.


Implications
The 2021 field season at Bridge Glacier was an overall success. The majority of the data is still being processed, so there are no tangible conclusions to be drawn from it as of now (stay up to date with publications here). That being said, there is valuable insight to gain from observations during the field work. Based on discussions with local pilots and previous experience of lab members at Bridge Glacier, the marketed retreat of the glacier over a very short period of time was validated. The July trip was just after a large heat wave throughout the lower mainland, and evidence of this could be observed in the high streamflows that did seem to taper a bit throughout the trip. It also should be noted that both trips had to be navigated around British Columbia’s wildfire season which could impact further research at Bridge Glacier. It will be critical to apply knowledge gained through the 2021 field season at Bridge Glacier in order to better tailor methods for future projects and to understand implications of changes at glaciers for downstream areas.
The impact of recent climate change on the evolution of Bridge Glacier- In the Last Ten Years (2011-2021)
Introduction
This is the second of a three-part series of blog posts examining the impact of climate change on the evolution of Bridge Glacier. In part two, we take a closer look at what has been happening at the glacier over the last decade. In the first post, we established that since the end of the Little Ice Age , Bridge Glacier has been steadily retreating, and the rate of retreat has intensified exponentially over the last 70 years. The loss of so much ice mass has changed the morphology of the glacier and the forefield, and the magnitude of these changes will likely continue to increase for the foreseeable future. In order to better understand the current ramifications of this retreat on the evolution of downstream water resources and the calving dynamics of the glacier, here we zoom in and take closer look at what has happened at Bridge Glacier and its proglacial lake over a smaller timescale, the last decade.
Bridge the Calving Glacier
Bridge Glacier is a freshwater-terminating, lake-calving glacier. As previously mentioned, the reduced stress on the buoyant terminus floating in the lake generally leads to more rapid retreat, as compared to land-terminating glaciers undergoing the same change in climate (Benn et al., 2007). In some cases, even during positive accumulation years, it is still possible for these glaciers to lose significant volume due to calving (Chernos et al., 2016). Understanding the retreat rate due to calving is important to conceptualizing overall mass balance and freshwater contribution to downstream water bodies (Dyurgerov & Meier, 2005). Quantifying the rapid growth of proglacial lakes due to calving and retreat is essential, as a rapid increase in volume can heighten the risk of glacial lake outburst floods (GLOFs) hazards downstream (Kellerer-Pirklbauer et al., 2021).
Past studies of lake-calving glaciers suggest that the rate of retreat due to calving is contingent on the general flow speed of the ice, water depths in the lake, and width of the valley.These factors can vary dramatically over shortperiods so it is important to observe them over short time scales.Increased depth to lake bottom, more rapid flow of ice, and wider valley width all increase the rate of calving of a glacier and as these factors generally equilibrate following astep pattern themagnitude of change can be quite large over a short period of time. (Chernos et al., 2016; Motyka et al., 2003; Trüssel et al., 2013).
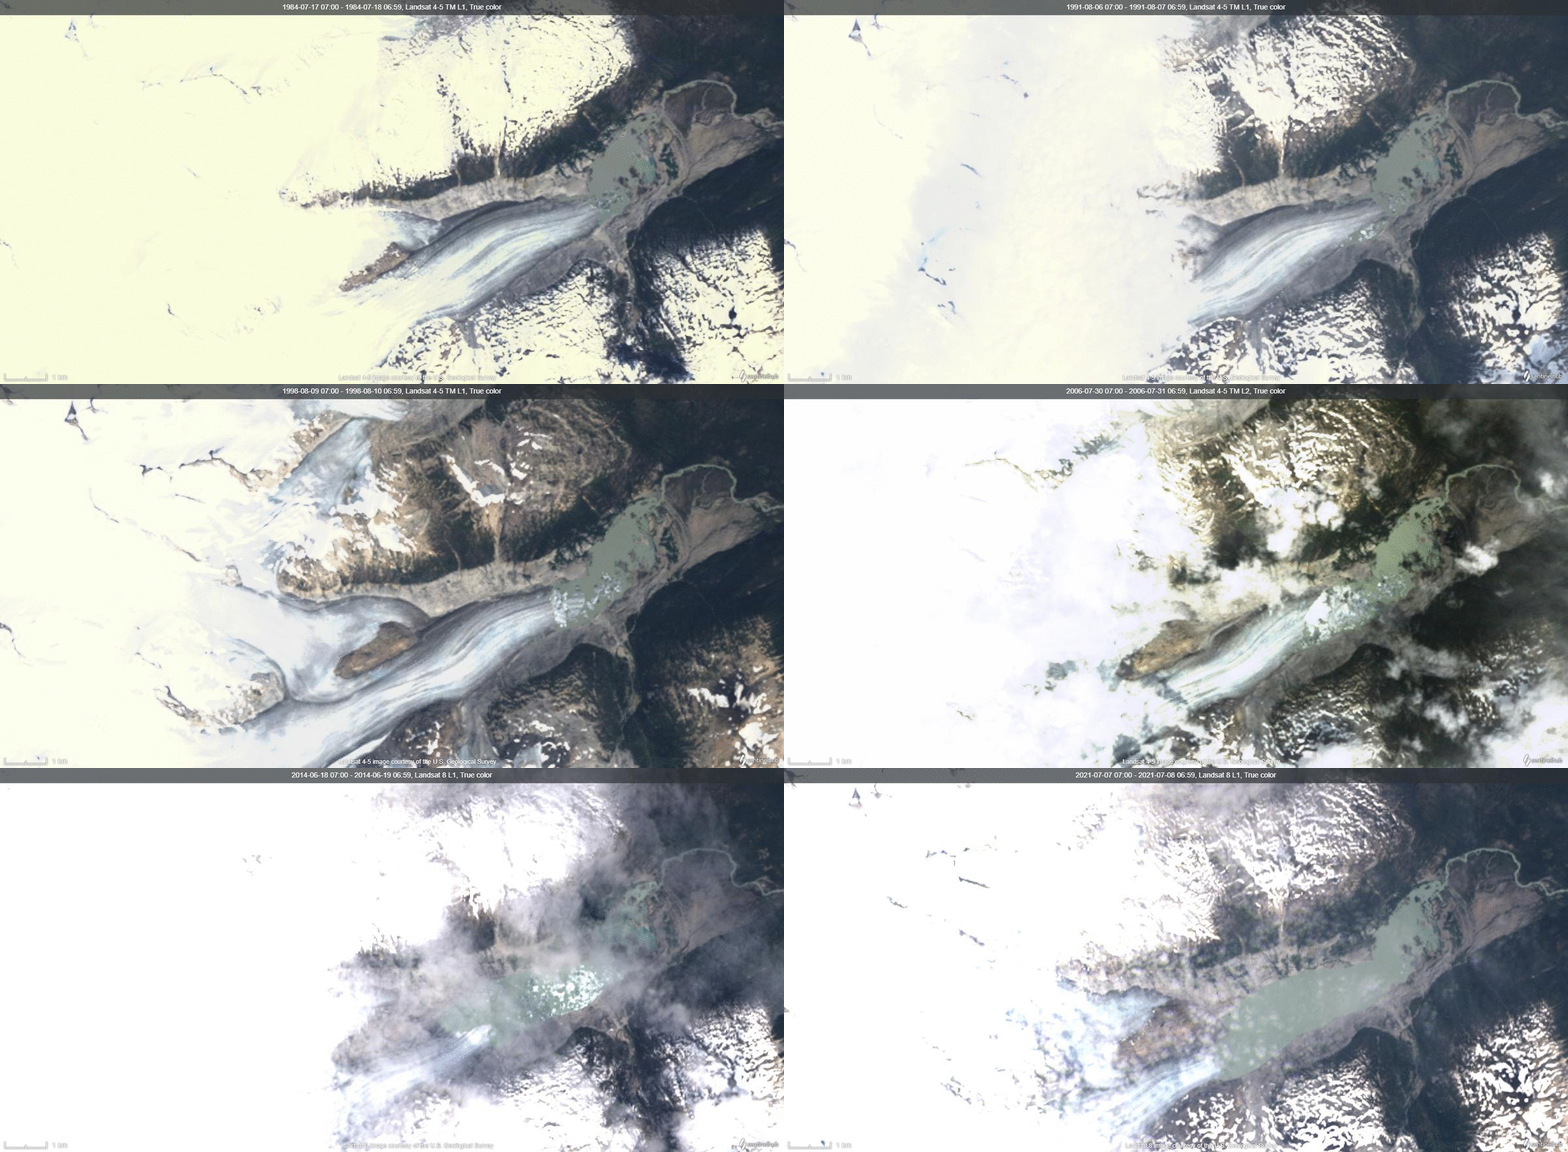
Landsat Imagery GIF of Bridge Glacier from 1984-2021
Chernos and co-authors focused on ablation from both calving and surface melt at Bridge Glacier, which were captured using time-lapse photography, ablation stakes and automated weather stations (AWS) during the summer of 2013 (Chernos et al., 2016). The meteorological data were fed into a Distributed Energy Balance Model (DEBM) to assess the melt rate by calculating the ingoing and going radiation at different elevation points along the glacier. The total ablation due to calving was quantified by measuring the retreat and flow speed at the terminus of the glacier where it entered the lake. The total volume of ice mass loss was based on the change in glacier length and the ice thickness, which they derived from the lake bathymetry and the height of the ice cliff at the terminus. This study indicated that calving contributed to about 23% of total ablation in 2013, but was not likely a significant source of ice mass loss until 1991, when retreat intensified in general after the separation of the terminus into the northern land-terminating section and the southern lake-terminating one (Chernos et. al 2016). Based on observations from other lake-calving glaciers, and the observed morphological changes in the proglacial lake, Chernos et al. (2016) concluded that Bridge Glacier will likely reach a point in the next few decades where the southern terminus will exit the lake and ablation from calving will no longer be a significant source of mass loss, potentially resulting in a stable terminus.
A study of lake-calving glaciers in Austria found that the eventual detachment of the glaciers from the proglacial lakes caused a decrease in backwasting (i.e. lateral retreat of ice or ice-cored slopes) (Haidong et al., 2010; Kellerer-Pirklbauer et al., 2021). As of the summer of 2021, Bridge Lake was over 7 km long, an expansion of approx. 2 km since 2013. This is fairly staggering as between 1985-2016 Bridge Glacier had retreated only 4.1 km , 3km of which was between 2004-2016 (Pelto, 2017). It is impossible to know without further bathymetric measurements if calving has reached a maxima, and the glacier terminus is grounded. Evidence from aerial imagery, however, shows a significant decrease in the number and size of icebergs in the lake over the last ten years, indicating that the mass loss from calving has likely been decreasing over this time.
Bridge Glacier- 2011
Bridge Glacier- 2015
Bridge Glacier- 2017
Bridge Glacier- 2021
Landsat Imagery showing decreasing number of icebergs
While there are several factors that control ablation at a calving terminus, at a grounded terminus ablation and glacier retreat is primarily controlled by the climate (i.e. surface melt due to increasing temperature or decreasing precipitation). This suggests that when Bridge Glacier becomes grounded and land terminating, any further retreat will become more directly predicted by climate change (Boyce et al. 2007; Chernos et al. 2016). The eventual detachment of Bridge Glacier from the proglacial lake will likely decrease the rate of overall mass loss, but the impact on the downstream hydrological systems , and up glacier valley slope stability has not been investigated and little is known on how this will impact the surrounding ecosystems and communities nearby. It will be critical to attempt and quantify how the transition from lake-terminating to land-terminating will spur on morphological changes at Bridge Glacier ( Kellerer-Pirklbauer et al., 2021).
Impacts of Bridge Glacier Retreat on Discharge into the Bridge River
It is generally accepted that with glacial retreat, runoff increases until the glacier has either completely wasted or reaches a new glacio-climatic equilibrium. A new equilibrium is reached when the glacier’s area decreases to a point where runoff generated decreases in proportion to the shrinking glacier area (i.e., a smaller glacier will generate less runoff than a larger one). This likely will decrease flow in subsidiary glacially-fed streams (Janson et al., 2003; Moore et al., 2009). This is particularly true in late summer, when the seasonal snowpack is no longer contributing to runoff (Moore et al., 2020; Braun et al., 2000).
Moyer and co-authors looked at downstream discharge variability from Bridge Glacier between 1979-2014, using historical hydrometric data from the Water Survey of Canada, weather data from Environment Canada stations nearby, and Landsat imagery of Bridge Glacier, to assess the change in discharge from the lake over time. They found that during winter months runoff from the lake downstream increased due ice and snow displacing water in the lake. In accordance with predicted trends discharge in the late summer decreased over time (not found for early summer). This was attributed purely to the change in the glacier area (i.e. the meltwater was proportional to the area of the glacier if it had not retreated) (Moyer et al., 2016). They predicted that as Bridge Glacier transitioned from a calving glacier to a land terminating glacier the rate at which summer discharge would decrease could be impacted (Moyer et al. 2016).
Average Monthly August flow from 2011-2019 data from the Water Survey of Canada accessed using ‘tidyhydat’ package.
Winter discharge increased throughout the study due ice and snow displacing water in the lake, but since 2014 snow and ice present in the lake has decreased and the volume of the lake has increased, which could cause the winter discharge to decrease. That said there have been no studies of the winter discharge at Bridge glacier since 2014, so it is hard to make a definitive conclusion without further investigation.
Average Monthly January flow from 2011-2019 data from the Water Survey of Canada accessed using ‘tidyhydat’ package
Changes in discharge can have ramifications for downstream ecosystems, soil quality, biodiversity, community water supplies, and drinking water quality (Laurent et al., 2020). In order to assess these potential impacts it is crucial to get further predicted changes in discharge due to glacier retreat.
In conclusion, over the last ten years both the calving rate and calving contribution to total melt and discharge from the lake at Bridge Glacier have been altered by climate-induced retreat of the glacier. These changes all have the potential to cause significant harm to downstream communities and ecosystems and it will be critical to conduct further assessment of these ramifications. In our final post, we will look at the continuation of these trends into the 2021 field season, in the hopes of gaining new insights into how these changes are impacting the glacier forefield, as well as downstream communities and ecosystems.
The impact of recent climate change on the evolution of Bridge Glacier- Since the Little Ice Age
Introduction
This is the first of a three-part blog series examining the impact of climate change on the evolution of Bridge Glacier. We begin our journey by examining the rate of retreat of Bridge Glacier and the resulting changes in the morphology of the glacier forefield since the Little Ice Age (LIA). Next, we will take a closer look at changes over the last 10 years to gain a better insight into how ongoing climate change is impacting the dynamics of the glacier. Last, we will investigate trends observed at the glacier during the 2021 summer field season, as well as explore the future of Bridge Glacier and the downstream impacts of ongoing retreat.
We start our journey 147 km south of Bridge Glacier in the city of Vancouver. From here, it is a 6-hour drive up mostly dirt road to the Tyax Lodge and Adventure tourism operation outside of Goldbridge, BC at a crossroads of the unceded traditional Lil’wat and St’at’imc territories. At Tyax, we are surrounded by groups of mountain bikers, and hikers catching flights into the backcountry, we load our supplies up into a floatplane and take off from Tyaughton Lake. On our floatplane flight to the glacier, we see summer cottages, logging operations, and as we fly deeper into the valley Chilcotin mountains rise around us, the Bridge River meandering through. Suddenly we see it! Bridge Glacier, descending from the high peaks and terminating in a turquoise lake where small, calved icebergs glisten as they drift across the water. As we exit the plane, we see the striking contrast between the sparkling white ice and the grey almost “barren” till, we hear the rushing sounds of glacial streams, and feel the cold katabatic wind descending down the glacier surface. We have arrived…
Flying into Bridge courtesy of Michele Koppes
The Field Site
Bridge Glacier (50◦48′11′′ N, 123◦38′40′′ W) is an outlet of the Lillooet Icefield, located in Southwestern British Columbia, nestled in the Pacific Range of the Coast Mountains. From head to toe the glacier loses approximately 1510m in elevation. In 2013, the glacier covered an area of approximately 83 km2 but has retreated significantly since then. Bridge Glacier is currently a lake-calving glacier (i.e., one of the two arms of the terminus ends in a proglacial lake). (Chernos et. al 2016). The reduced stress on the calving terminus (i.e. its’ buoyancy in water) generally leads to more rapid retreat compared to completely land terminating glaciers (Benn et al., 2007). Calving glaciers are unique in that they usually retreat in a step-like pattern (i.e periods of relative stability followed by rapid retreat) that typically coincides with the flotation of the terminus (Warren and Kirkbride, 2003; Boyce et al., 2007; Dykes et al., 2011).
Location of Bridge Glacier made in QGIS
Bridge Glacier is not only a breathtaking sight, but it plays a major role in the local hydrological cycle, along with other alpine glaciers in the region. Any changes in glacier mass balance impact downstream water resources, influencing water quality, aquatic habitat, and agriculture in the Bridge River watershed, and in particular the large Bridge River BCHydro hydroelectric project which produces 6-8% of the province’s energy needs (Barry, 2006; Chernos et al., 2016; Radić & Hock, 2011; Zemp et al., 2015). Alpine glaciers generally respond more rapidly to increases in temperature compared to large ice sheets and are more likely to contribute to surrounding hydrological systems (Maurer et al., 2019). Alpine glaciers that cover areas as small as 1-2% of their respective catchments, have been found to contribute to changes in seasonal streamflow; these glacial contributions are particularly important in warm, dry periods such as the late summer months when there is little precipitation (Stahl & Moore, 2006). With the intensification of climate change, it has only become more critical to track the evolution of alpine glaciers in the region. Bridge glacier hence serves as a proxy for changes in lake-terminating glaciers throughout the PNW Coast Mountains (Chernos et al., 2016; Moyer et al., 2016).
The History of Bridge Glacier Since the little ice age
In this first, blog we will be looking a Bridge Glacier, since the Little Ice Age. So, what even is the ‘Little Ice Age’? Throughout the Holocene there have been periods of abrupt climatic variation; during these cycles, global average temperature falls and rises cyclically (Lockwood, 2001; Dahl et al., 2002). In the Northern Hemisphere the last of these temperature declines was about 0.2 °C and lasted from approximately 1300 CE to 1850 CE, this period is often referred to as the ‘Little Ice Age’ (LIA) although there is some argument among experts on when it exactly began but it is fairly well established that the LIA ended at the start the industrial revolution. Global average temperature has been generally moving in an upward trajectory post the LIA (Dahl et al., 2002; Matthews & Briffa, 2005). It is estimated that due to this warming, glaciers globally have lost 25% of their area in the 20th century (Luckman, 1995).
Global average Temp post 1850-2020 from Rohde (2021)
A 2002-2003 study approximated the terminus of Bridge glacier using dendroglaciological dating, a technique using radiocarbon dating of subfossil wood buried in glacial till and lichenometric dating, a technique that establishes a minimum surface date of rocks using measured lichen thallus diameter to suggest how long a particular rock has been exposed to the surface. The study indicates that the glacier expanded throughout the LIA with the maximum down valley extension occurring around 1367 CE this was roughly 3,000m down valley from the 2003 terminus (Allen & Smith, 2007). The LIA maximum extent is marked by a distinct trimline and lateral moraine on the side of the valley this is demarcated by the tree line.
Trimline at Bridge glacier marked in pink, photograph courtesy of Michele Koppes.
From 1367- 1949 CE Bridge only retreated approximately 1,000m but from 1949-2003 it has retreated over 2,000m indicative of its current rapid retreat due to climate change (Allen & Smith, 2007). From 2004-2013 the glacier retreated nearly 3,000 m at a rate of 250 m/year and by aerial photo analysis in 2021 the glacier had retreated approximately another 1600 m.
There have also been changes in the morphology of the glacier due to its rapid retreat. A 1991 study utilizing 14C dating, tree ring count, and historic air photographs suggest that Bridge glacier previously impounded ice-marginal lakes (i.e lakes that are dammed by ice or moraine of a glacier), by 1970 CE they were completely drained due to reduction in ice mass (Ryder, 1991). Evidence of said lakes can be seen in the glacial outwash plain. The initiation of these lakes occurred around 1405 CE post the LIA maximum and although carbon dating suggests that glacier retreat began in around 1860 CE with the start of the industrial revolution, the lakes remained at their original level until around 1935 CE. The loss of said marginal lakes was due to failure of ice and moraine dams caused by a series of floods initiated by rapid glacial melt flow, this further solidifies evidence for rapid retreat and morphological change throughout the 20th century into the 21st (Ryder, 1991).
Planet image from August 2021 (Planet, 2017) Bridge Glacier aerial photo with the demarcation of historical termini. Solid lines indicate the historical terminus position from 1985-2013 from Landsat Imagery, whereas dashed lines are approximated termini from LIA and 1945.
Along with the direct morphological changes at the glacier attributed to rapid retreat, there is also potential for ecological changes. There are not currently any peer-reviewed papers published on the ecology of Bridge Glacier post-LIA but the removal of ice from the valley allowing for the colonization of previously ice-covered regions by alpine flora has been observed during fieldwork. A study of several alpine glaciers in Norway found that the first species began to appear on newly exposed till approximately five years after deglaciation (Prach & Rachlewicz, 2012). Changes in ecology could impact everything from the stability of the till to what large fauna could arrive in the area so it is important to consider when discussing the evolution of Bridge Glacier. Another study of alpine glaciers in the Alps suggested that vegetation in glacial forelands is dependent on both seed arrival paired with timing of suitable environment for growth, this indicates that to obtain estimates of where and how rapidly vegetation is occurring at Bridge Glacier a specific study of the area is needed (Erschbamer et al., 2008).
Indian Paintbrush (Castilleja mimiata) growing on a moraine at Bridge Glacier identified from Parks Canada, photo courtesy of Michele Koppes.
In summary, we have established that since the end of the Little Ice Age Bridge Glacier has been in steady retreat which has intensified exponentially over the last 70 years and this trajectory will likely continue. The loss of so much ice mass has changed the morphology as well as the surrounding environment of the glacier and the magnitude of these changes will also likely increase for the foreseeable future. In our next blog, we will dive deeper into what has been occurring at the glacier over the last 10 years and begin to piece together the future implications for climate change-triggered retreat at Bridge. Thanks for joining us on our journey and we hope to see you back for the next part of the series!
