Week 6 Trading

This week I spent a lot of time downloading and manipulating Bloomberg data in Excel.  In spirit of our upcoming project proposals, I thought I’d share how to use the Bloomberg Excel Add-In. The terminal is a very good source of data. I will also share a couple of graphs I created to think about when trading wheat.

First off, go to the Bloomberg (BB) terminal – it’s located in CLC 222, the Sauder computer lab in the Canaccord Learning Commons.

Open excel and click on the Bloomberg Add-In (on the excel ribbon). There are various ways to input formulas here, including using the Data Wizard – probably the simplest method.

Whether you are using the data wizard or typing the formulas directly into your spreadsheet, it is important to understand how the formulas work, so that you can adjust the formulas to your needs.

There are only 3 excel formulas for BB and a ton of data fields. Using wheat as an example, the formulas are:

1)   Bloomberg Data Point (BDP) returns a single data point to your spreadsheet. For example, = BDP(“W Z3 Comdty”,”Px_Last”) returns the last price for the December wheat contract. “W Z3 Comdty” indicates the security of interest. “Px_Last” is a data field and it indicates the kind of information needed. I will shortly explain how to search for data fields.

2)   Bloomberg Data History (BDH) returns the historical data of a security. For example, = BDH(“W Z3 Comdty”,”Px_Last”,”10/25/2012”, ”10/25/2013”) gives the December 2013 wheat contract’s last price for each day from 10/25 2012 to 10/25/2013.

3)   Bloomberg Data Set (BDS) returns multi cell descriptive data to your spreadsheet and follows a similar format as the BDH formula.

The quotation marks can be omitted if a cell is selected instead. So for example, if cell A1 contains: W Z3 Comdty, then you can use the formula =BDP(A1,”Px_Last”) instead of = BDP(“W Z3 Comdty”,”Px_Last”).

To search for data fields, one way is to open the BB software on the terminal and type “FLDS” and then press “GO”. Now you can search for data fields by typing information of interest, pressing “GO” and then browsing the related data fields’ codes and descriptions.

With this information, you are ready to look up and download almost anything from the BB terminal and your data will be live. It’s so exciting!

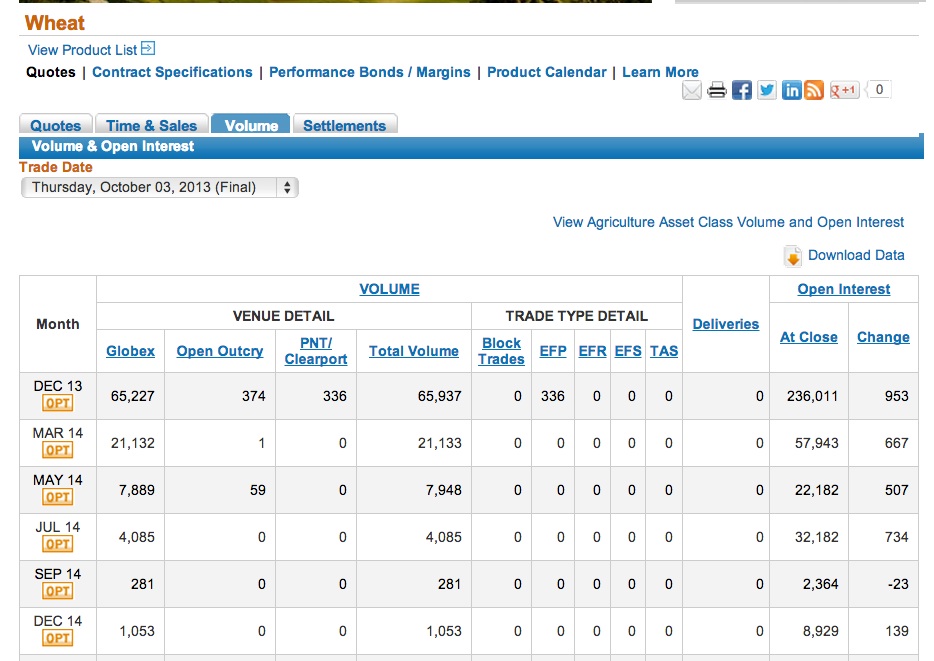
Here’s an example of what you can do. I was interested in the historical physical prices of wheat. As we learned in class, these are equal to the future prices at contract expiration. So I used the Bloomberg Add-In to gather this information.

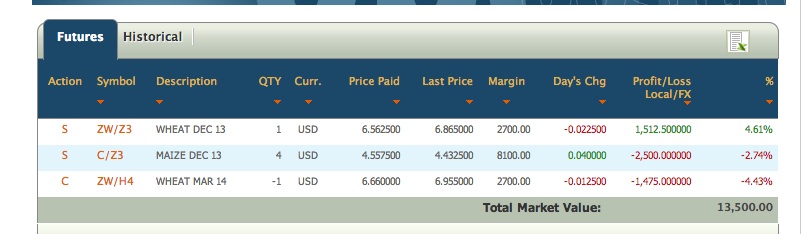
First I listed past contracts and the dates at which they expired (I used normal excel formulas for this part). Then I used a BB formula to get the price of wheat for the contract indicated at the dates indicated. Then I repeated the formula for each row. This is how my spreadsheet looks like.

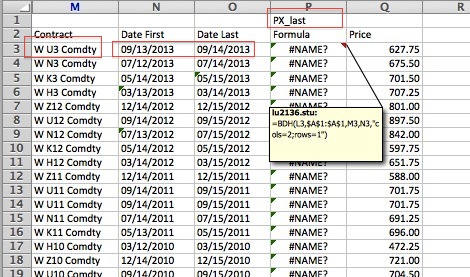
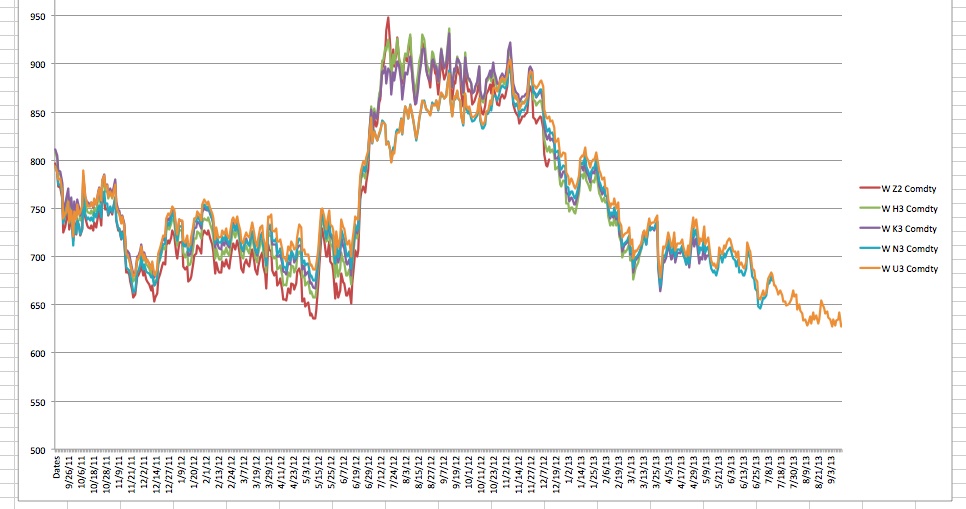
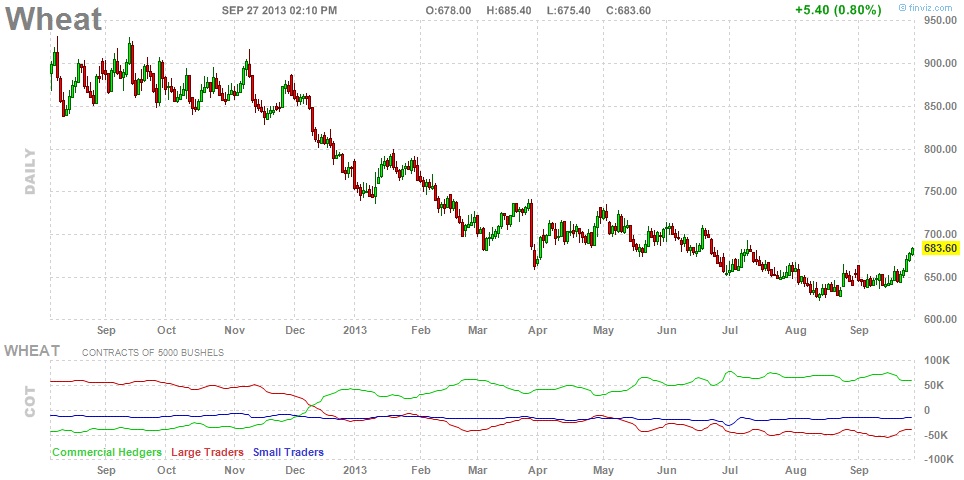
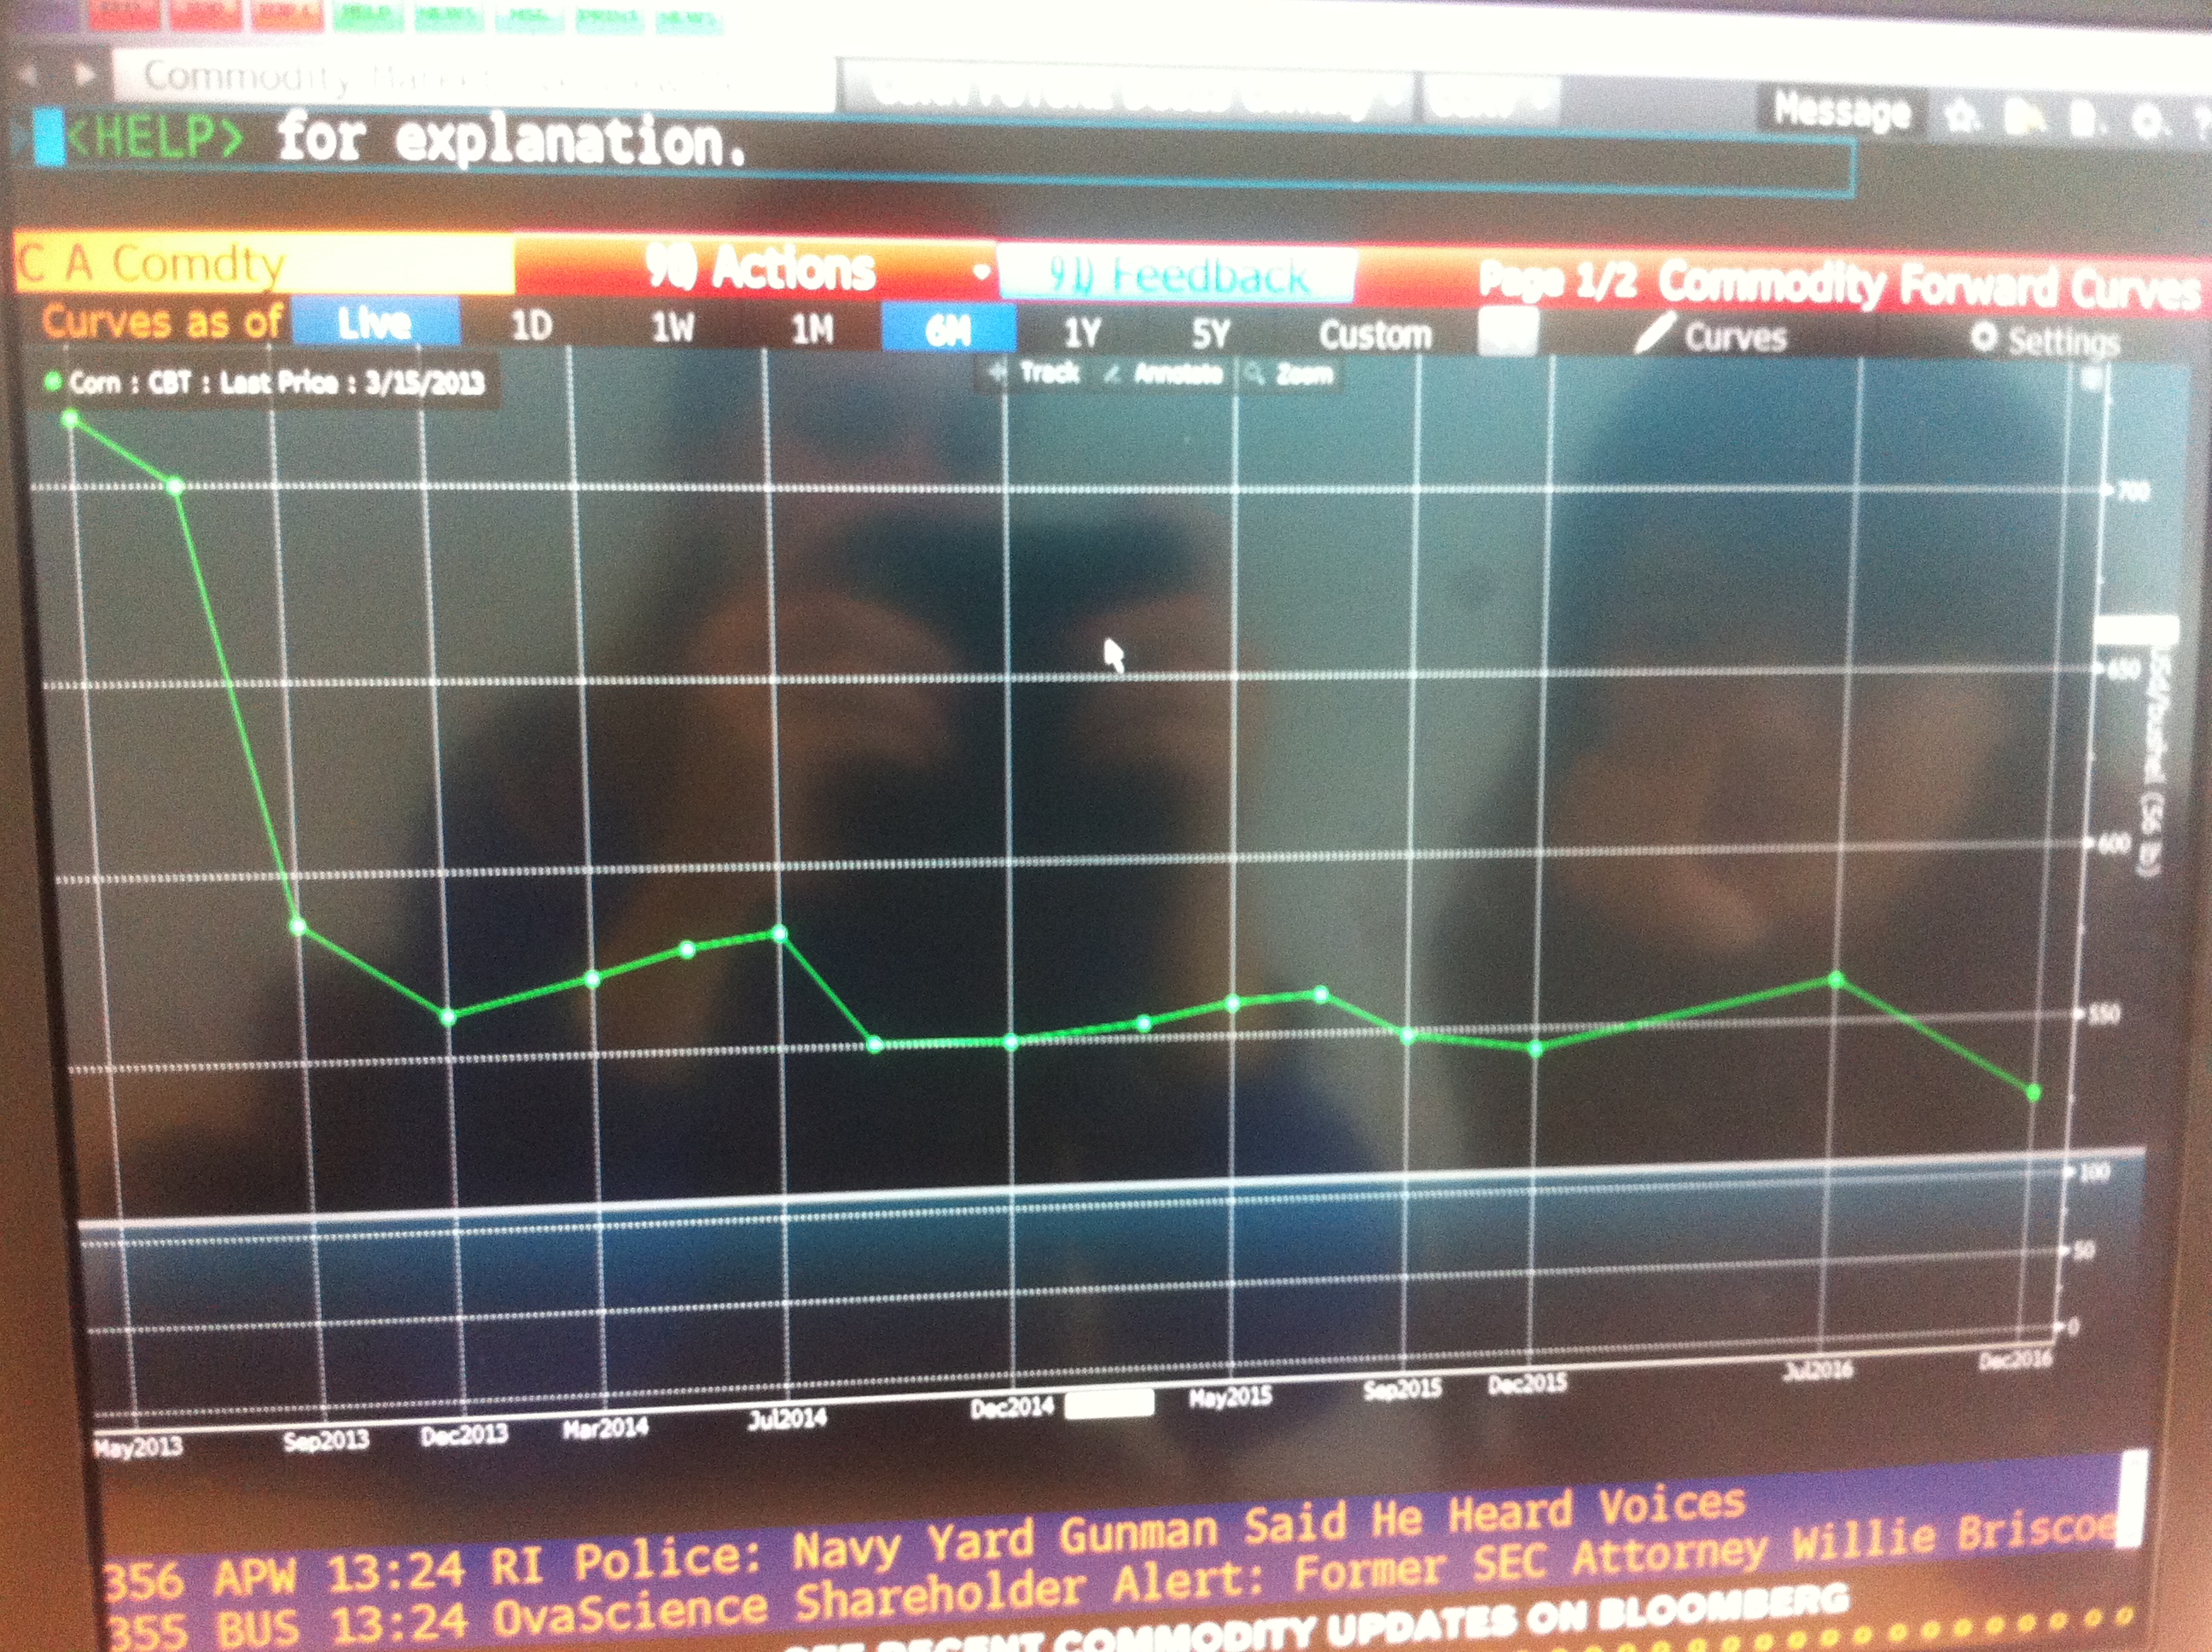
Here’s how the results look like once graphed:

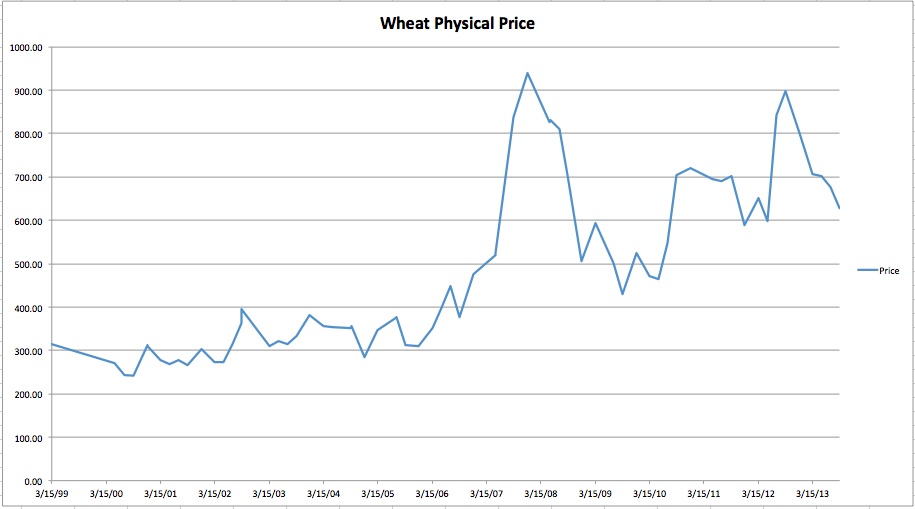
The graph represents derived historical physical prices of wheat.

My Bloomberg tutorial is over. If anybody has questions or needs help downloading information for their project, please let me know.

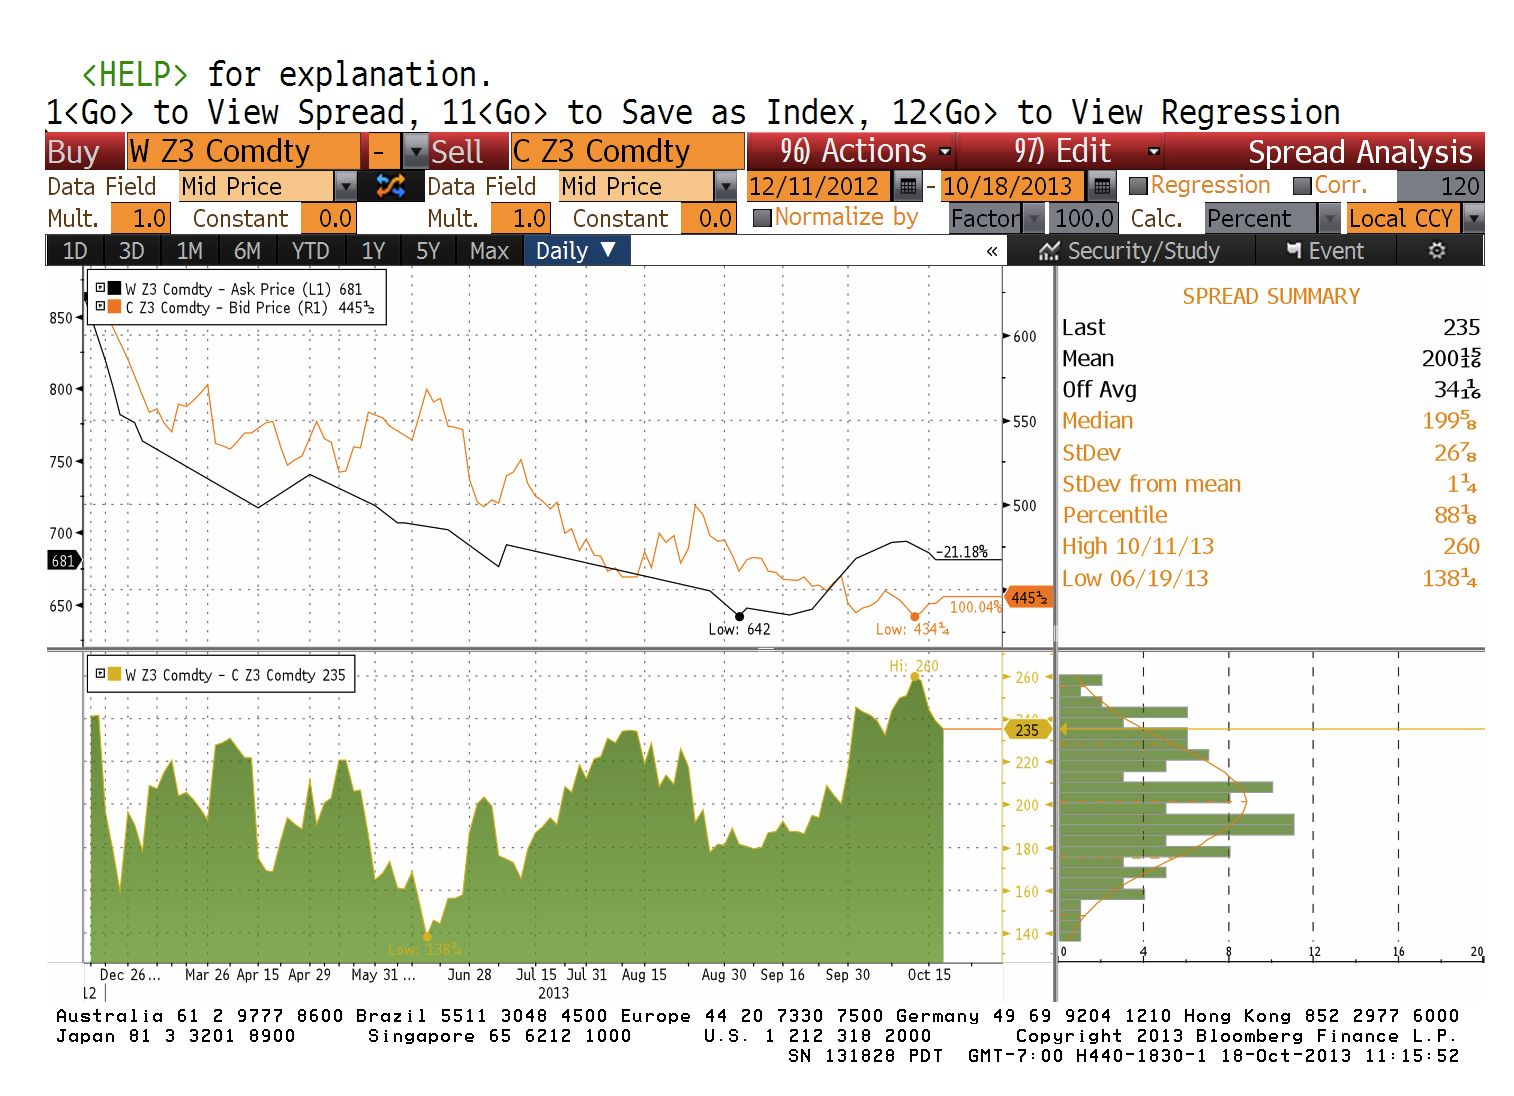
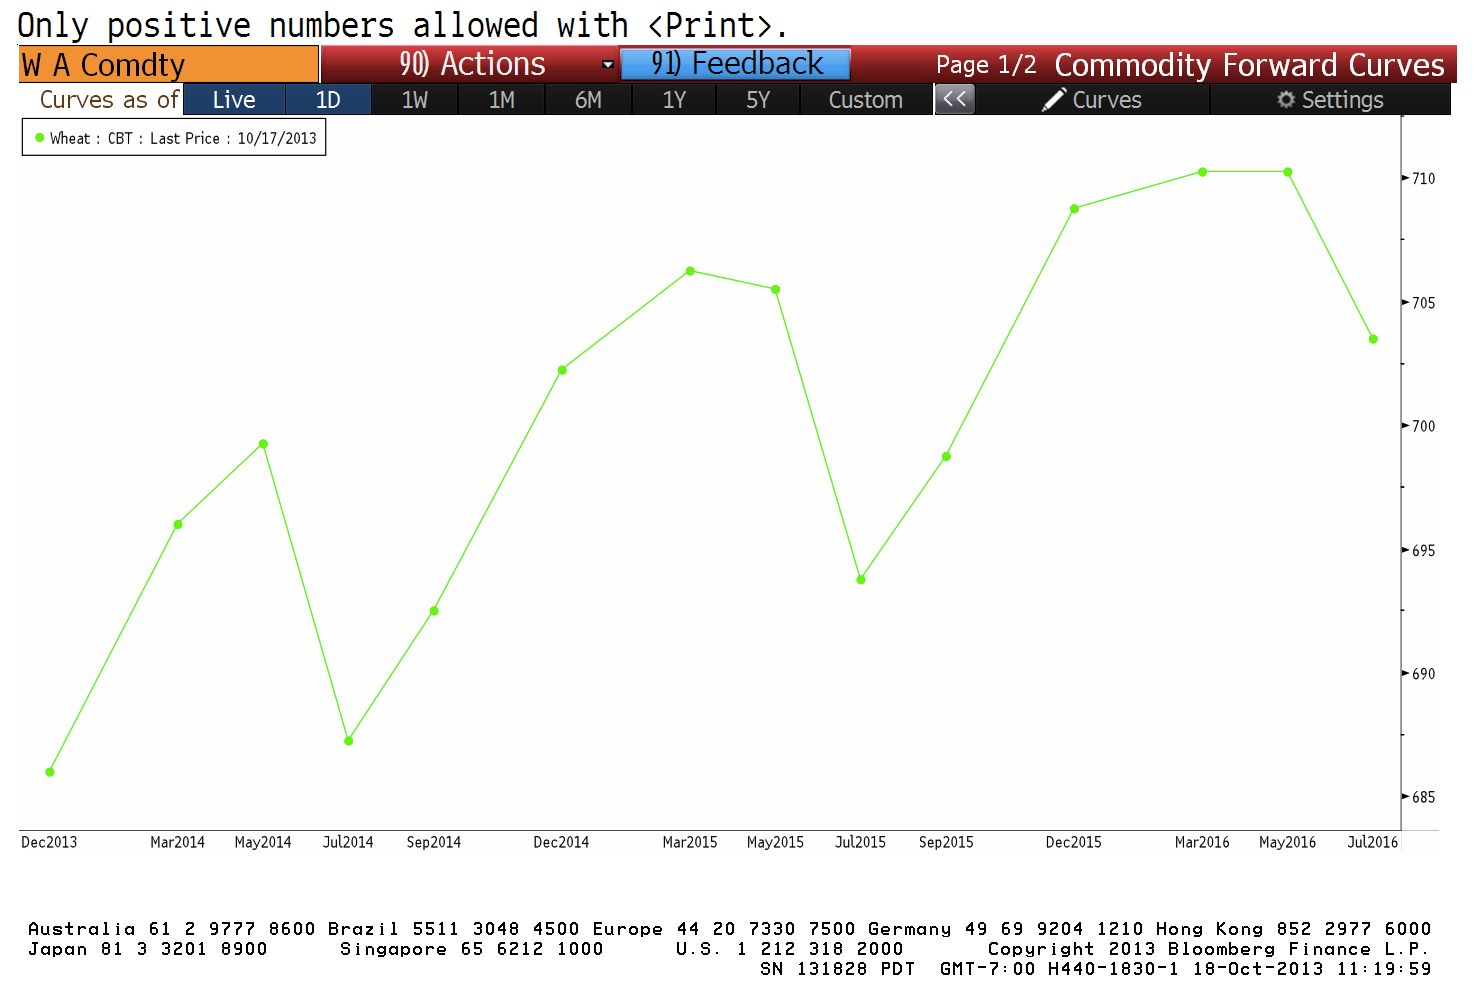
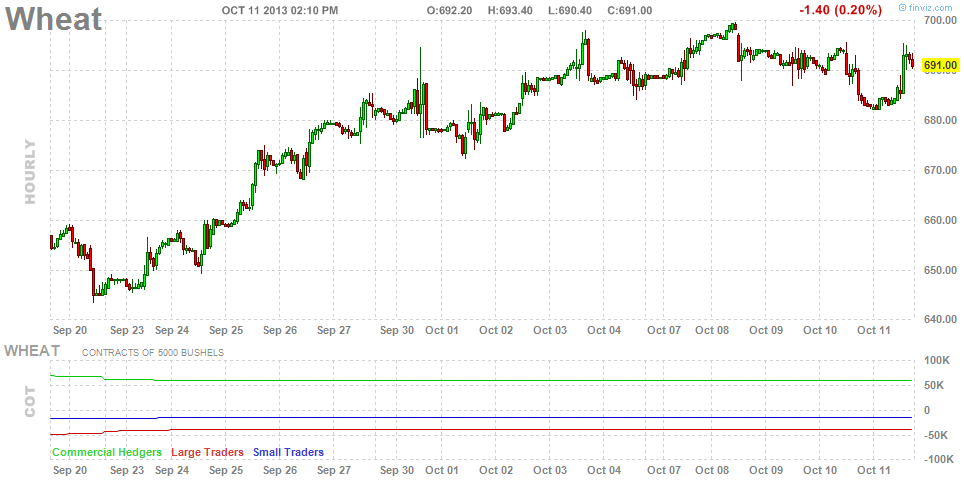
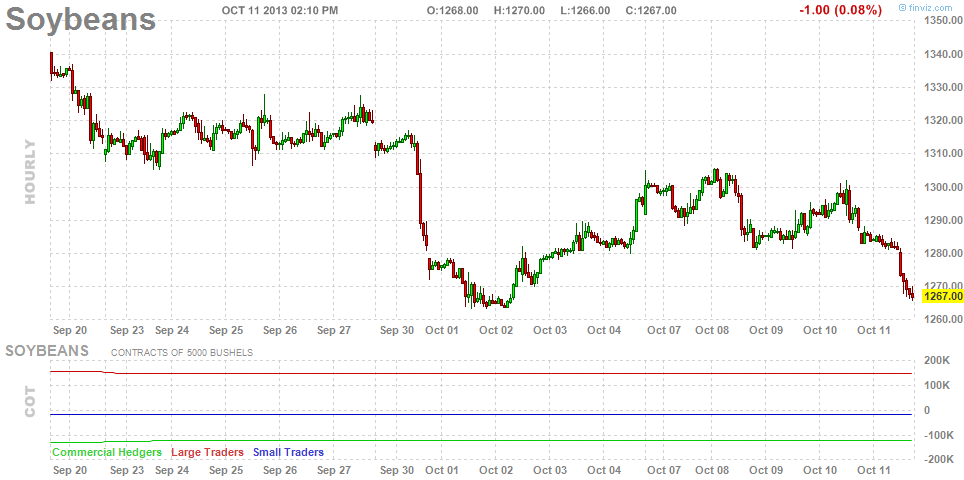
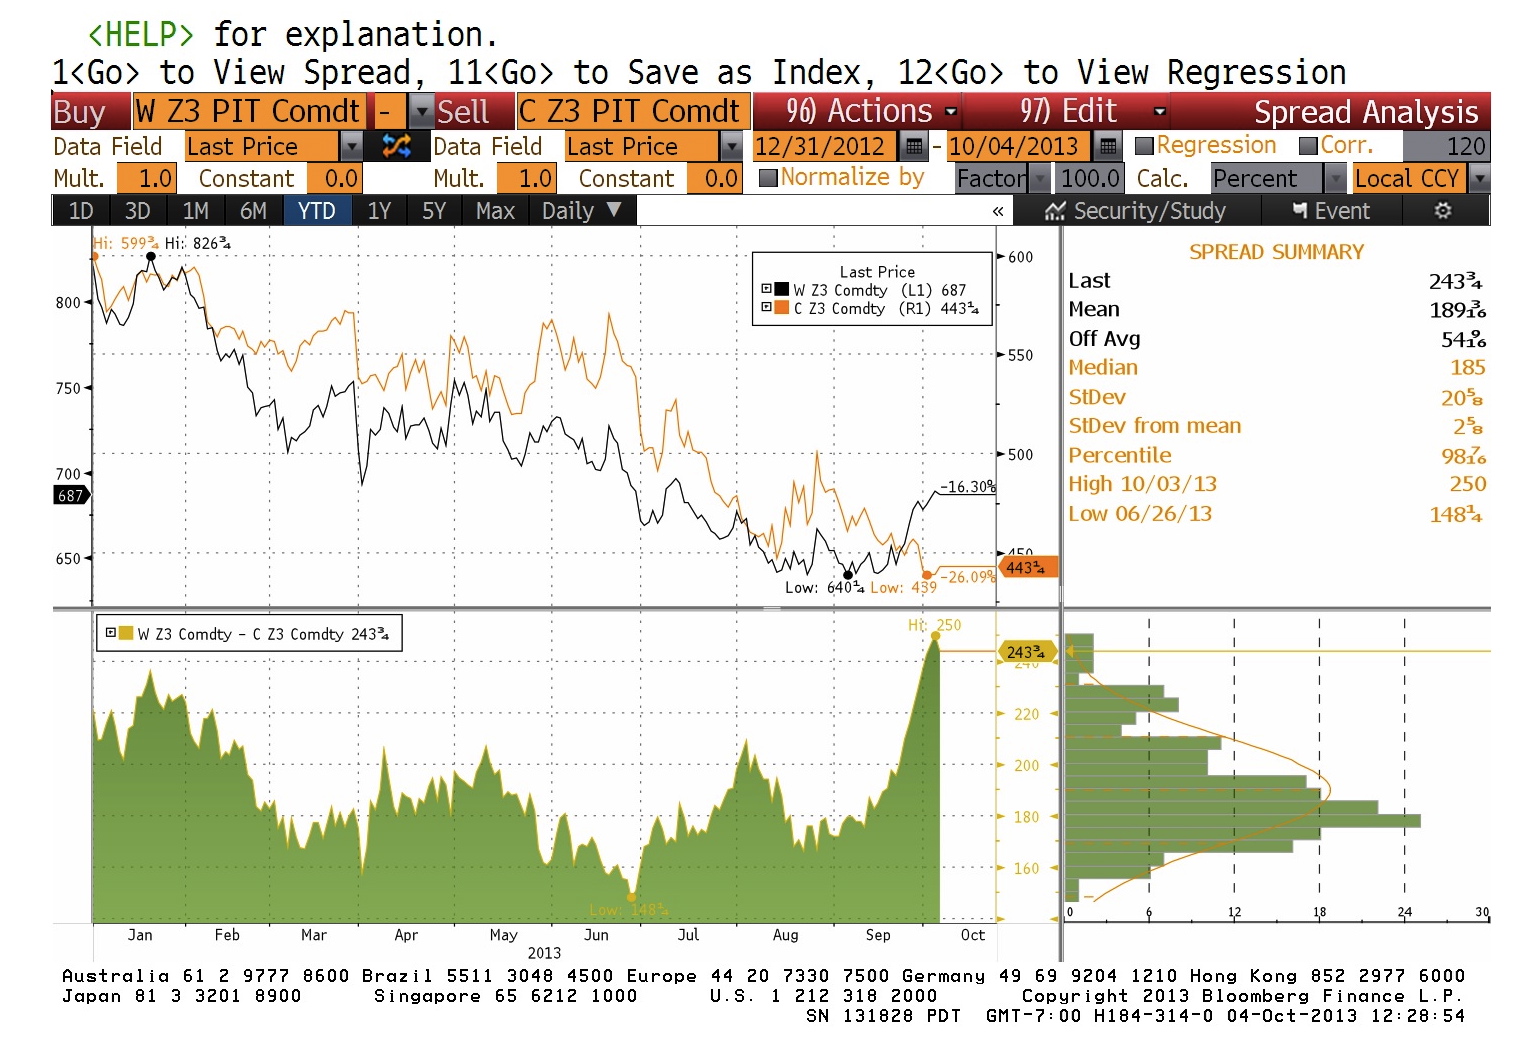
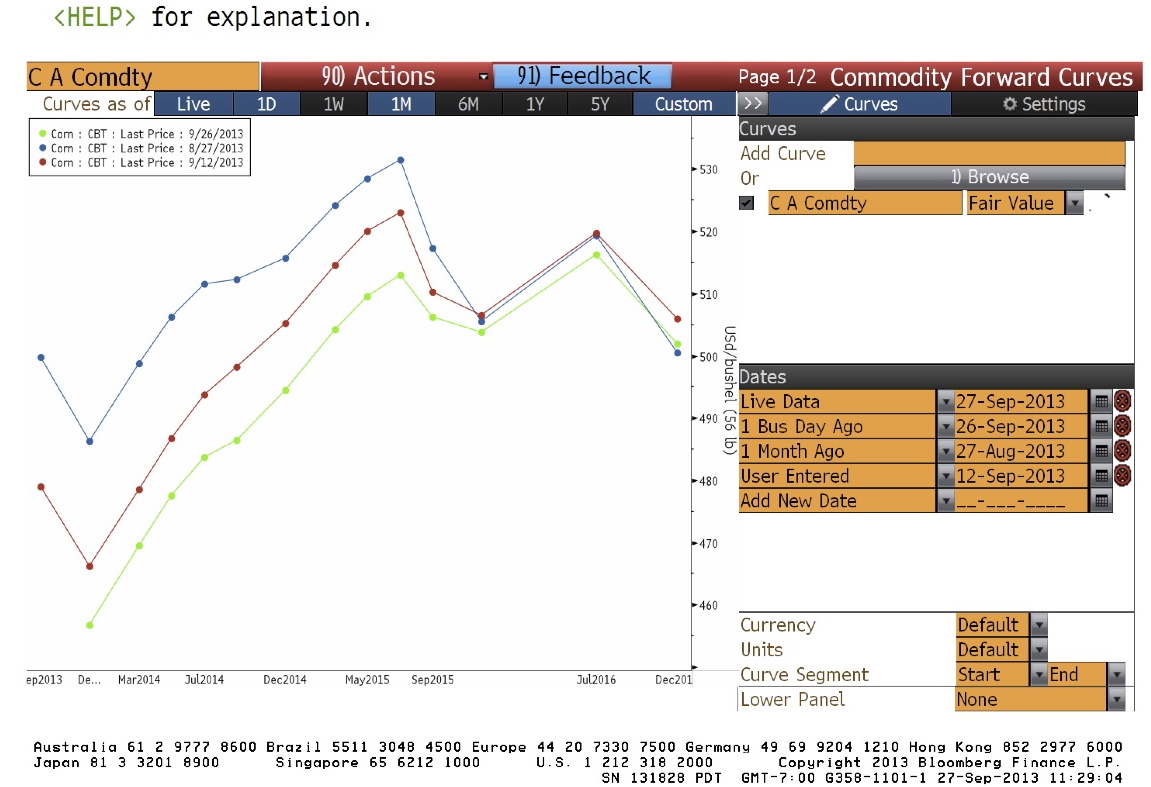
Here’s a one more graphs on wheat prices that I created using Excel and the Bloomberg Add-In.

25. October 2013 by laurauguc
Categories: Uncategorized | 1 comment

Week 5 Trading

EPA on Ethanol Blend

This week in our lab, we discuss an EPA decision to reduce ethanol use in gasoline next year. My immediate thought was that it would lower the demand for both ethanol and corn, reducing both prices. But the opposite happened this week. Upon further investigation, I learned that this piece of news was only a rumor – possibly a wrong one. Reuters, who even reported on EPA documents that showed the agency proposing an unexpected drop in the amount of corn-based ethanol that would be required for blending next year, later admitted that some industry exports questioned the documents’ authenticity. The reversal of this news update, combined with the attention turning on low ethanol inventory, caused ethanol futures advanced (narrowing the spread to gasoline).

Corn Harvest Delays

Increased rainfall in the U.S. Corn Belt is expected to delay corn harvest. See the BB screenshot below for a more detailed description and weather map.

Wheat-Corn Spread

The wheat-corn spread continues to be unusually large – the highest since December 2010. As explained in my earlier posts, corn and wheat are demand substitutes and the spread between them fluctuates significantly.

Today, a Bloomberg article discussed this matter. Here’s a couple of interesting points it made:

  • Wheat analyst are the most bearish since July on speculation of the grain’s biggest premium to corn in three years will curb demand.
  • Out of 24 analyst surveyed by BB News, 13 expect prices to fall next week, 5 are bullish, and six are neutral, the highest proportion of bears since July 26. Goldman Sachs Group Inc. estimates that prices will drop to $6.50 in three months, 7.4% less than now.
  • The USDA raised its estimates of global wheat production
  • Canadian farmers may harvest a record 33 million tons, 22% more than a year earlier.
  • Brazil and China buying to restock inventories spurred a 3.7% gain in prices last month, the most since April. However, “demand news may not live up to expectations built into the recent rally” said Dale Durchholz, a senior market analyst for AgriVisor LLC, who advises to sell the grain.

Price-Stock Pattern

The theory discussed in class predicts prices rising throughout most of the year as firms incur the cost of storing the commodity and sharply declining during harvest. I was happy to see this concept clearly reflected in the future’s curve for wheat. Here’s an image:

My portfolio performance

During the past week, my portfolio continued to perform poorly. I also traded  very little. I only had two open positions (one spread).


18. October 2013 by laurauguc
Categories: Uncategorized | 1 comment

Week 4 Trading

This week, I decided to trade without using the BB terminal. I thought that it would allow me to step back and look at the bigger picture. But having got so used to information at my fingertips, I kept on thinking of the questions that the terminal would help me answer. So frustrating! Next week, I’ll be returning to the terminal.

Wheat-corn Spread Update

The wheat-corn spread further increased to $2.58 per bushel from last week’s $2.43.  Over the last year, this spread only came close to this amount in January, when it peaked at $2.36. By contrast, in June, the spread only amounted to $1.48. Corn production and stocks higher than expected resulted in the decline of corn prices, while higher demand for wheat in China increased the price of wheat, explaining the increase in the spread. But, if these commodities really are demand substitutes, buyers should start switching to purchasing corn instead of wheat; the spread is just too large.

Week’s Review

No major news update relating to agricultural futures occurred this week.

Wheat initially increased, then decreased, and then returned at about the same level as the end of last week. A large downward movement followed by a symmetric upward movement occurred on Oct 11th-12th .

Corn started to climb at the beginning of the week and then fell at the end. Interestingly, the increases happened over a series of small steps while the decreases are deep and sudden. This pattern of small increases followed by deep decreases has been occurring throughout the year (see corn graphs below).

Soybeans declined sharply at the end of the week, ending with an inverted hammer patter, signaling a possible small trend reversal.

Note: the preceding graphs were taken from  http://finviz.com/

Portfolio Performance & Lessons Learned


As the above graph shows, my portfolio continued to perform poorly.

Lesson Learned: Make more trades. I realized that I spend more time researching than actually making trading decisions. I only placed 6 transactions since the beginning of the trading game, some of which I held against my own analysis. I need to trust my analysis and start implementing trading decisions.

11. October 2013 by laurauguc
Categories: Uncategorized | Leave a comment

Week 3 Trading

Open Interest

This week I decided to learn about open interest, a concept very useful to futures trading.

Open interest is the total number of options and/or futures contracts that are not closed or delivered on a particular day. It is not to be confused with volumes of trade. For example, if A buys 5 futures from B, trading volume increases by 5, but open interest doesn’t change. Similarly, if A takes an offsetting position by selling 2 of the futures it just bought, open interest is reduced by 2 while trading volume increase by 2. On the other hand, if C sells a futures contract and D buys a futures contract, both volume and open interest increase by 1.

Open interest is important for trading for 2 reasons. First off, it’s an important measure of liquidity. Most importantly, it’s a good indicator of whether trends will persist or reverse. According to Investopedia, “An increase in open interest along with an increase in price is said to confirm an upward trend. Similarly, an increase in open interest along with a decrease in price confirms a downward trend. An increase or decrease in prices while open interest remains flat or declining may indicate a possible trend reversal.”

Applying this idea to corn and wheat, we note that the change of open interest on Thursday for wheat’s active contract is 953 – or .4% of total open interst at close. By contrast, the change of open interest for corn is 635 – or .09% of total open interest – a much lower amount. Even other months’ corn contracts have a larger absolute change in open interest (and a lower total open interest). This indicates that open interest for corn is stabilizing and therefore, is a signal of a trend reversal.

Wheat – Corn Spread

After a bit of research on spreads on the BB terminal, I noticed that the wheat-corn spread is unusually high. It reached the highest peak since at least a year (see BB graph below).

For highly correlated commodities like wheat and corn (see correlation matrix below), the spread should fluctuate around some intermediate level. Therefore, the spread appears to be reaching a peak. If this is the case, then shorting wheat and buying corn is a way to short the wheat-corn spread.

Here’s a correlation matrix for corn, wheat, soybeans, and crude oil.

Brief Market Review

This week’s largest event was the release of the USDA quarterly grain stock report. Stocks were significantly lower than last September, but much higher than what the market expected, putting downward pressure on prices. As China continues to seek wheat from Australia, wheat prices continued to rise slightly at an unsteady pace. However, the price of corn, a demand substitute for wheat, continued to decrease, with a large drop on Monday and a slight recovery over the week. Like corn, soybeans dropped at the release of the crop report and slightly climbed back during the week.

My portfolio performance

The table below shows how my open positions have performed. I decided to buy corn at random at the beginning of the trading game and despite the continuing decline, I can’t get myself to sell it. My other purchase is a calendar spread (as discussed in my previous blog plot). This spread continued to do well, but the price difference between the two positions has narrowed enough to justify a sell. So my sell and cover order is due to go into effects when the markets open on Sunday evening.


04. October 2013 by laurauguc
Categories: Uncategorized | Leave a comment

Week 2 Trading

Market Summary

The following is a Bloomberg (BB) graph of this week’s front-month future prices for our three commodities (wheat, soybeans, and corn).

The starkest change over the week is given by the 5.84% increase in the wheat price. The closing price on Friday represents the highest price level since mid-July, as shown by the following graph from finviz.com.

 CME Group provides the following reason for the increase: “Talk of lower planted area in Ukraine, possible new demand from Brazil and China and short-covering appear to be the primary reasons for the buying support.” I feel skeptical of the sustainability of this increase. In 2012, Ukraine only produced 2.34% of global wheat production. The increase in China’s demand should have been priced in by earlier news of bad weather affecting wheat crops in China. For example, on July 16th, Reuters published an article titled “Exclusive: China may become top wheat importer after crops ruined” (http://www.reuters.com/article/2013/07/16/us-china-wheat-idUSBRE96F1F120130716). The market had plenty of time to react to this information.  Further, wheat and corn are demand substitutes, so any increase in wheat will be dragged down by corn’s not as good performance. Further, the burst in prices may be the cause (not only the consequence) of short-covering and that new short positions will push the price back down. Also, looking back over this year’s prices, week-long price rallies are typically followed by steep price decreases (see the above graph).

Over the week, soybeans and corn also increased (though not as dramatically as wheat), partially due to the spillover from wheat futures. Anticipation over Monday’s USDA Grain Stock Report also caused some stirring.

Something to ponder about is the change in the corn’s futures curve (see the BB graph below). Since last month (the blue line), the price significantly shifted downwards to the red line – the futures curve two weeks ago. The downward shift continued until a week ago (the white curve) and partially reversed during the past week to the green line.

Looking ahead, the USDA’s Quarterly Grain Stocks Report is coming up on Monday.

My portfolio’s performance

 My portfolio performed as following.

Symbol

Exchange

Company Name

QTY

Currency

Price Paid

Last Price

Market Value

Profit/Loss (local curr)

P/L %

Margin

ZW/H4

US

WHEAT MAR 14

-2

USD

$6.66

$6.90

$68,950.00

($2,350.00)

-3.528528529

$5,400.00

ZW/Z3

US

WHEAT DEC 13

1

USD

$6.56

$6.82

$34,075.00

$1,262.50

3.847619048

$2,700.00

C/Z3

US

MAIZE DEC 13

4

USD

$4.56

$4.54

$90,750.00

($400.00)

-0.438837082

$6,480.00

This week’s price increases helped recover part of my loss on the corn long position I had placed two weeks ago. The December wheat future also increased. However, the March wheat future suffered, but by a lesser percentage than the increase in the December contract.

My reason for buying the December contract and shorting the March contract was that the calendar seemed too large for such short time periods. I thought that if the price of the March contract exceeded the December by too much, some firm would buy corn in December, store it, and sell a March futures contract, booking immediate profit. I realize that storing is expensive and impractical, but, if lucrative enough, some firm would do it. As I expected (though likely by coincidence), the price difference narrowed by 2 cents per bushel or $100 dollars per contract. However, I incorrectly expected a decline in wheat prices thereby loading my short contract by twice as much as my long. So the overall strategy resulted in a loss.

I don’t expect this week’s price increases to be sustainable, as discussed earlier. Monitoring the situation Monday morning, I will sell my long position and keep my shorts. However, just in case I’m wrong, I added a stop order to cover one of my wheat short position if the price increases to above $7.00 to reduce exposure.

27. September 2013 by laurauguc
Categories: Uncategorized | 2 comments

Bloomberg Terminal & Trading Plan

Bloomberg Terminal

For those interested, there’s a Bloomberg terminal on campus. It’s located in CLC 222, the Sauder computer lab in the Canaccord Learning Commons. It’s quite useful for trading; it has live price information, graphs, news, and other useful information.

Mia and I went to check out the machine today. We learned about a couple of good sources to learn the basics on how to use the terminals:

–       Here’s a brief Bloomberg database guide: http://www.gsb.stanford.edu/sites/default/files/bloomberg_0.pdf

–       And here’s a guide specific on looking up commodity information (scroll down to the commodities section): http://www.investopedia.com/university/how-to-use-bloomberg-professional-service/currencies-commodities.asp

To begin, start typing the futures contract name you are interested in and select it. Then, type ‘CMBQ’ and press the ‘GO’ key. Mia and I did see with corn and arrived to the following screen.

It is then possible to click on individual sections to receive more detailed information. For example, we were interested in the commodity forward curve, so we arrived at the following screen.

It is possible to customize the graph to show multiple curves.

First Week’s Trading Plan

My first objective for the week is to catch up on news related to corn and take a closer look at last week’s crop report. I will closely monitor the Fed’s announcements coming up on Wednesday about tapering; I’m very curious of its impact on commodities’ prices. For the market’s consensus before the announcement, see Bloomberg’s economic calendar: http://www.bloomberg.com/markets/economic-calendar/ . What will happen if tapering is greater or less than expected?

Once I’m caught up, I’ll revisit the Bloomberg terminal and decide whether price differences or changes are justified. I want to place at least one trade by the end of the week!

05. September 2013 by laurauguc
Categories: Uncategorized | 3 comments

Spam prevention powered by Akismet