Open Interest
This week I decided to learn about open interest, a concept very useful to futures trading.
Open interest is the total number of options and/or futures contracts that are not closed or delivered on a particular day. It is not to be confused with volumes of trade. For example, if A buys 5 futures from B, trading volume increases by 5, but open interest doesn’t change. Similarly, if A takes an offsetting position by selling 2 of the futures it just bought, open interest is reduced by 2 while trading volume increase by 2. On the other hand, if C sells a futures contract and D buys a futures contract, both volume and open interest increase by 1.
Open interest is important for trading for 2 reasons. First off, it’s an important measure of liquidity. Most importantly, it’s a good indicator of whether trends will persist or reverse. According to Investopedia, “An increase in open interest along with an increase in price is said to confirm an upward trend. Similarly, an increase in open interest along with a decrease in price confirms a downward trend. An increase or decrease in prices while open interest remains flat or declining may indicate a possible trend reversal.”
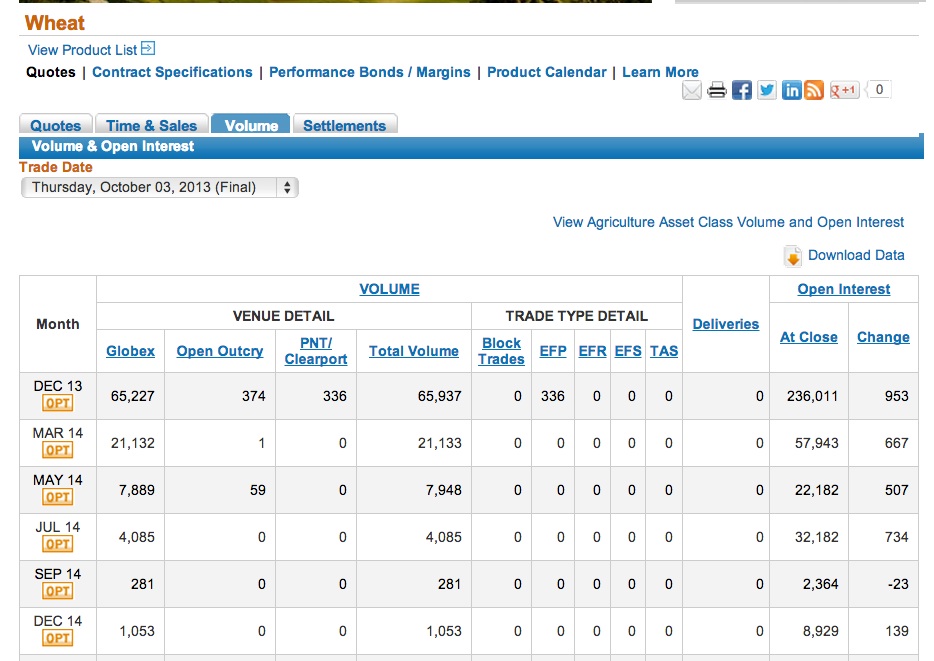
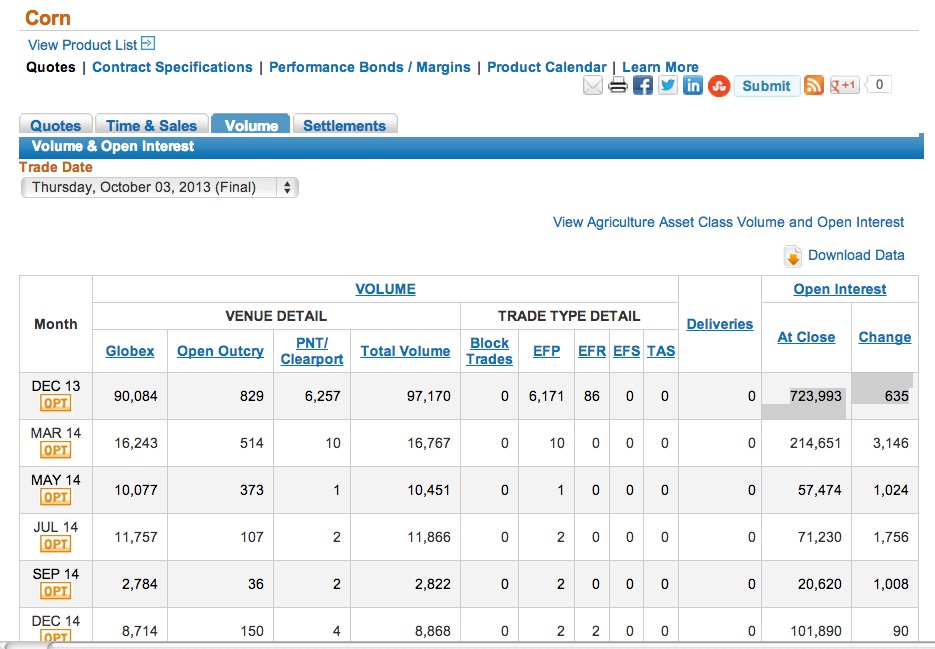
Applying this idea to corn and wheat, we note that the change of open interest on Thursday for wheat’s active contract is 953 – or .4% of total open interst at close. By contrast, the change of open interest for corn is 635 – or .09% of total open interest – a much lower amount. Even other months’ corn contracts have a larger absolute change in open interest (and a lower total open interest). This indicates that open interest for corn is stabilizing and therefore, is a signal of a trend reversal.
Wheat – Corn Spread
After a bit of research on spreads on the BB terminal, I noticed that the wheat-corn spread is unusually high. It reached the highest peak since at least a year (see BB graph below).
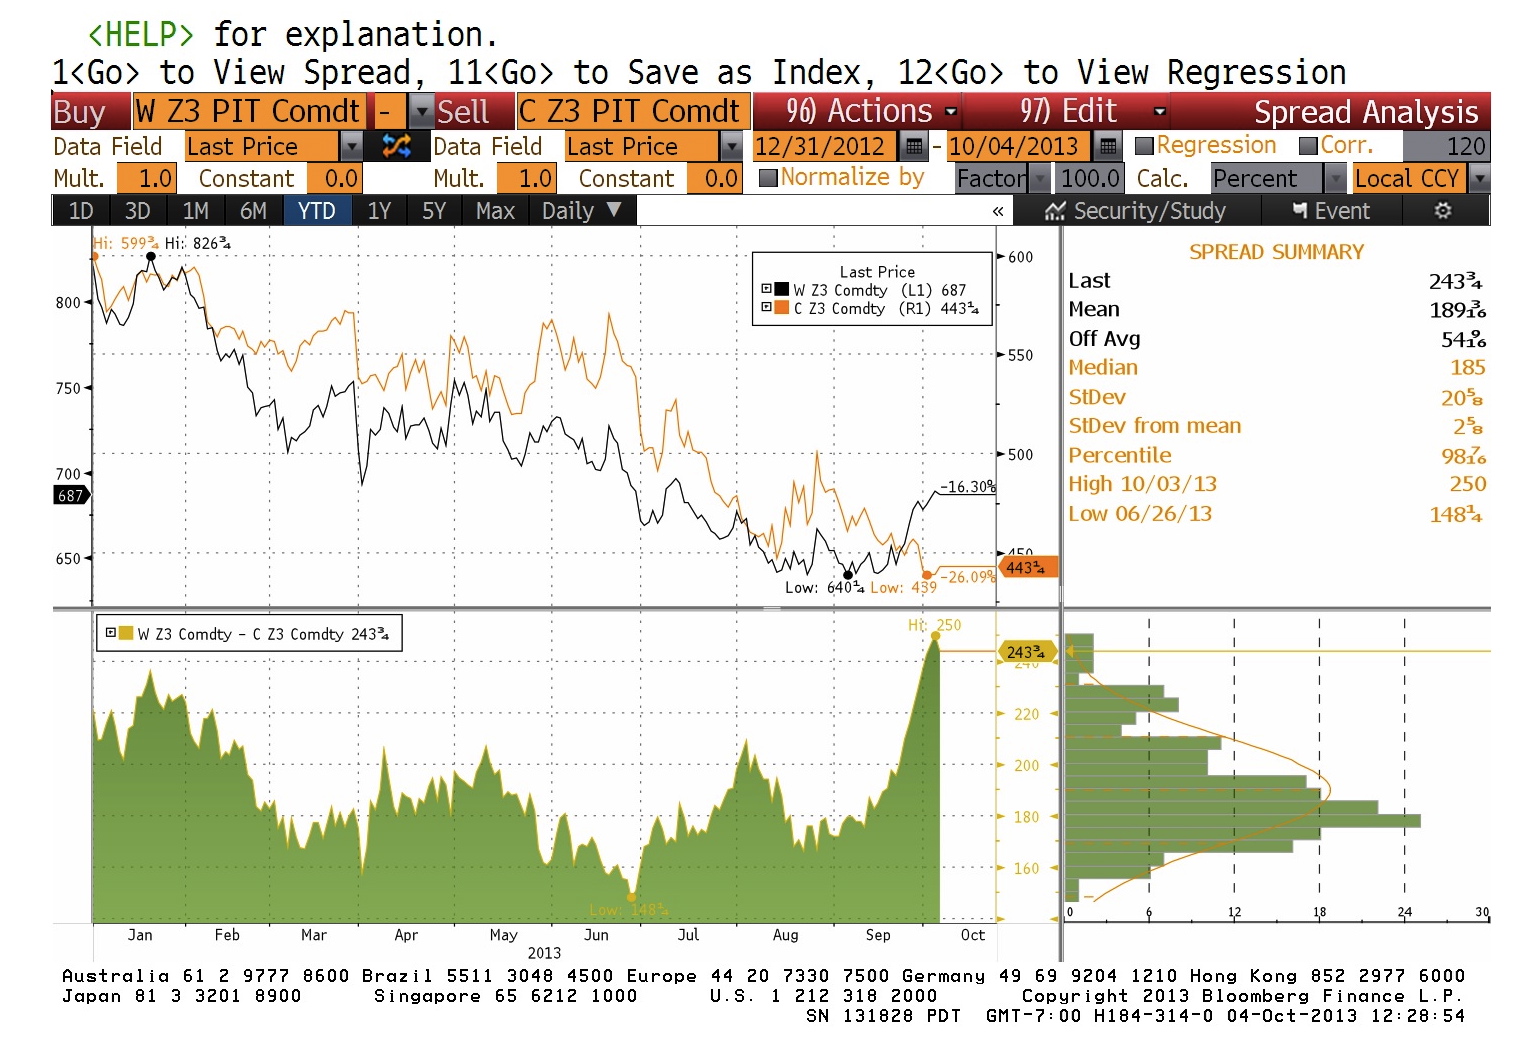
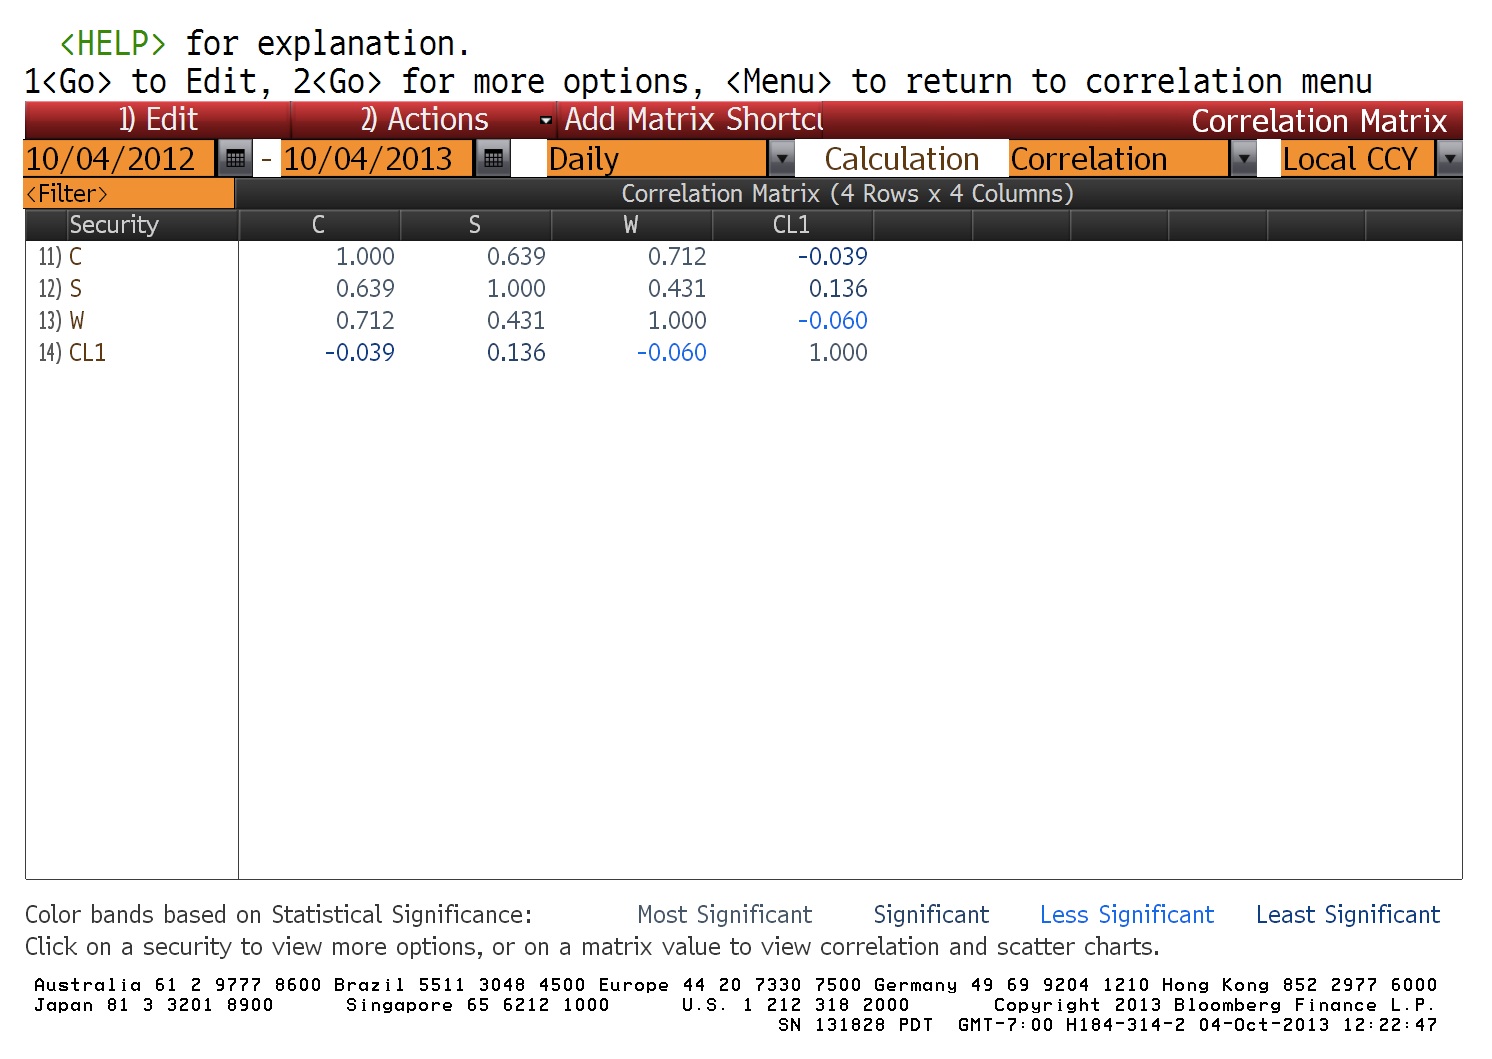
For highly correlated commodities like wheat and corn (see correlation matrix below), the spread should fluctuate around some intermediate level. Therefore, the spread appears to be reaching a peak. If this is the case, then shorting wheat and buying corn is a way to short the wheat-corn spread.
Here’s a correlation matrix for corn, wheat, soybeans, and crude oil.
Brief Market Review
This week’s largest event was the release of the USDA quarterly grain stock report. Stocks were significantly lower than last September, but much higher than what the market expected, putting downward pressure on prices. As China continues to seek wheat from Australia, wheat prices continued to rise slightly at an unsteady pace. However, the price of corn, a demand substitute for wheat, continued to decrease, with a large drop on Monday and a slight recovery over the week. Like corn, soybeans dropped at the release of the crop report and slightly climbed back during the week.
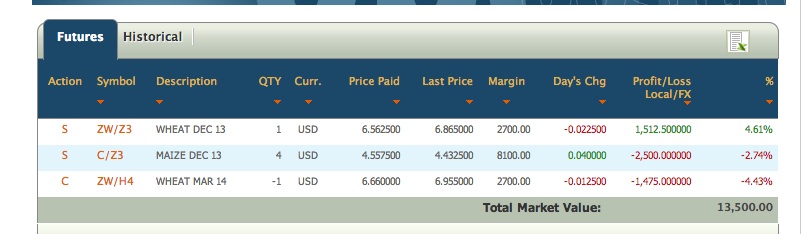
My portfolio performance
The table below shows how my open positions have performed. I decided to buy corn at random at the beginning of the trading game and despite the continuing decline, I can’t get myself to sell it. My other purchase is a calendar spread (as discussed in my previous blog plot). This spread continued to do well, but the price difference between the two positions has narrowed enough to justify a sell. So my sell and cover order is due to go into effects when the markets open on Sunday evening.
One reply on “Week 3 Trading”
Great breakdown of open interest dynamics in futures trading — I also explore such market-mechanics in depth at AimGrip .