
From the chart below, the collection of data for learning analytics can be divided into two categories: techniques and applications. For the purpose of this presentation, we will be focusing on the application of learning analytics, and primarily on: Trend Analysis & Prediction, and Personalization & Adaptive Learning. 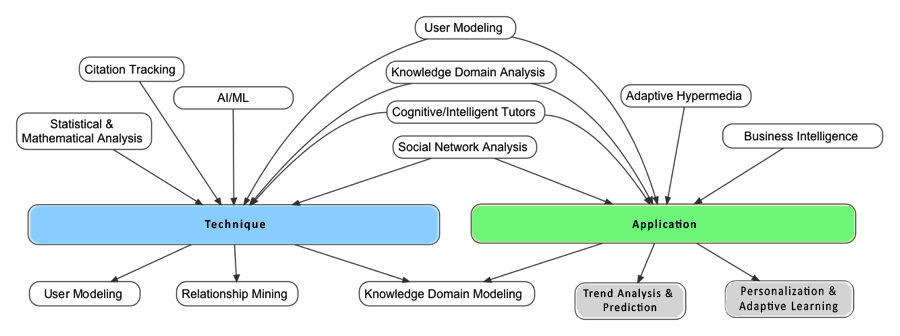
Trend Analysis & Prediction
|
Personalization & Adaptive Learning
|

Activity #2: Which Application is Right for You?
-
Select either Trends Analysis & Prediction or Personalization & Adaptive Learning to see the list of related companies/products on the market, or go to the Product Archive page and scroll down to see a more detailed list of learning analytics companies/products. (Please note there are two pages worth of products.)
-
Select one of the companies/products that either:
-
could be used to help solve the question/problem defined in Activity #1; or
-
interests you.
Use the tags to assist you.
-
-
In the “Comments” section below give a brief review of the company/product; its strengths and/or shortcomings.
-
Optional: Select another learning analytic company/product of your choice to comment on.
Activity #3: Using an Analytic Application
Click on the heading above to go to Activity #3.
In the analysis of the Panorama Advanced Analytics product, the product itself provides users with multiple capabilities that would definitely assist in measuring the application of instruction in a teaching education environment. In teaching information technology skills, you could pair up the Panorama application with online learning modules to measure the efficacy of IT application for teachers. It might be difficult to measure their application level, but teacher education courses could connect their systems to ensure teachers are taking the appropriate steps in applying valuable IT knowledge. The system is designed to measure business performance, but education is still quite new. The application provides solutions in other sectors, but with enough creativity, teacher instructors may use this in their training colleges. The application measures performance management, and provides intuitive data analysis which will be helpful in measuring how long teachers spend online, how often they are accessing web development tools, how frequently are they researching, and using collaborative technology interfaces such as web chats, and other web communication tools. The Social component of providing collaborative decision making through integrated social tools is impressive, and may be used with teachers in their correct application of technology. They may discuss what is important for developing effective e-learning tools, and which steps are required to manage and implement them.
http://www.google.com/intl/en/analytics/learn/index.html
I chose to explore Google Analytics. They are (in)famous for their data mining so I wanted to learn more. The Google site is definitely directed towards business, mainly marketing, with a focus on performance goals, audience and capacity.
“An ad click here, a page view there, a video watched on a tablet before bed… but which one clinched the sale? Google Analytics has the latest in full-credit measurement, so you see all the stops people take on the road to action. The result: a measurable way to improve campaigns and reach new audiences as they go through their days.”
However, I could see the information collected could easily apply to participant behaviour in an online course. What did they review,? For how long? When did they lose focus?
Google also has mobile app analytics. Again from an entrepreneurial point of view this would be invaluable, allowing you to know how people find you, whether they download your app and what in-app purchases they make. Again, this has limited application to education right now but I could see it being used to track student behaviour as they use and interact with apps that could provide insight into their learning. Right now the app analytics tracks engagement and impact. These are important when you are selling apps but it could also apply to students using the app. The fact that the information is gathered in real time would be valuable to a teacher planning and personalizing learning.
One Canadian company that has built in LA is Vince Education http://www.vincieducation.com/ They have created a tablet for Pre-K-3 that gathers continuous data on a child’s interaction with the device and its apps. The difficulty I have with this type of data collection is it appears to be “numerical” – right/wrong, number of attempts, time, etc. It is easier to gather this type of data but to my mind much of it is lower order thinking. Yes the student can add 2 + 2 but can they apply it? do they have number conservation or has they just figured memorized the fact? In the example on the site the two games are “count the fruit” and “name the rainbow colours”. My first question is “why?”, the second is what would I learn about my student as a learner if I know they got 14/15? Is there a better way to get this information? Do I need this information?
Everyday Assessment – Track your students’ progress in real time, brought to you by ClassVINCI game-based lessons on the tablet which are connected to the cloud! While each student is playing, data is collected and analyzed. Feel free to look into your class performance for the particular lesson, or focus on particular students or student group to see how they are doing. http://www.vincieducation.com/everyday-assessment/
In my mind the LA push reflects the US education system’s intense focus on data and numbers rather than good pedagogy and engaged learners. They are obsessed with it to the detriment of students and teachers (IMHO). I think LA has potential when applied judiciously, but do we really need to know (and analyze) every move our student makes? I’m not sure.
Thanks for sharing the LA examples and resources Kendra! Also, thanks for sharing your concerns! You have identified some valid issues worth further exploration. It leads to the question of how do we ensure the information gained from learning analytics is used in a constructive way.
Not sure if anyone posted this but the link for Google Analytics doesn’t work.
Kendra
Thanks for pointing this out. I’ve just updated it and the link should be working properly now.
I took a look at D2L Degree Compass. The part that caught my eye was the “on-time completion of degrees”. I think this can be used in my workplace as a tool to help complete a software implementation plan. Often adopters of our program have every intention of sticking to their plan, but as busy professionals other hiccups along the way makes it difficult to stick to a schedule. By customizing core and optional courses that they are going to be successful in will help keep clients on track and can help me monitor milestones.
Hi,
I looked at the Trend Analysis, Course Signals program, and I thought that this could help me with my issue related to participants not spending the appropriate time in completing their e-learning courses, as well as under utilization of materials because it adds a personal element. Through direct prompts and communication the participant can be monitored (in areas where they are not experiencing successes) and they can also be encouraged to press on.
I looked at MATHia Software from Carnegie Learning. It is made for students grades 6-12 and it has learning modules for students to work through. I found the product very comprehensive, if you were to use it in your classroom you would probably want it to be your primary resource. I tried the grade six practice module and it looked good. I was first worried that all of the questions were multiple choice which would make it a terrible product however the questions and answers were varied. There were a lot of chances for students to go back or to access more help on each topic and it looked like students couldn’t move on to a new question until they mastered the previous one. I don’t know how this looks to the teacher, does the teacher see all of the attempts? Does the teacher see a breakdown of what the student struggles in? Does the teacher only see the questions that the student has mastered?
I’m not sure I would use MATHia software in my classroom although it may fit well with others’ teaching styles.
I chose to review D2L Compass. I think it is an excellent predictive technology. Not every student knows what direction to take in terms of educational and career goals. Some students may take a long time to figure out where their strengths lie and counselling is not always available. By mapping structural course sequence data against historical student achievement data, D2L makes course recommendations to students that will help increase their chances of success. At the very least, it eases the pain of finding out in the middle of a school year that you’re in the wrong course!
Only a few days ago, D2L announced its partnership with IBM. By integrating business intelligence with its learning analytics, D2L can now combine academic classroom data like grades and attendance with institutional data such as financial performance and strategy management. It would be interesting to see if this expanded view of the relationships between content, grades, student engagement, and institutional data will lead to much better learning experiences and outcomes for students.
I took a close look at ASPIR EDU. Their trend analysis prediction technology detects possible high-risk students in the online courses. This service links to my initial question in the first activity this week. Their Dropout Detective analyzes students’ performance metrics and calculates the data with their original “risk index score” that enables instructors’ outreach for retention. The cloud source based service that works through the existing learning management systems makes easy integration into the existing online platforms and programs. I am not sure if they have started already, but when they connect their business to the MOOCs’ big data, their service will be more influential.
Desire2Learn program for k-12 level can be used to measure student progress and to take actions accordingly.It provides an analytics tools that give teachers the ability to assess, report on, and improve student performance. I already know that some schools in Ontario are using D2L , which have recently launched its “Binder app”for any mobile device. The integration also involves a content partnership with McGraw-Hill, Cengage Learning, Nelson Education, Pearson, Wiley and Macmillan. In their customer service stories I searched for customer feedback on their assessment tool for K-12 but couldn’t find any.
Pearson offers powerful trend analysis and prediction tools that educators can use to devise effective intervention strategies. Educators can analyze results question by question. Pearson stores the accumulated data in a central repository that educators can easily access to quantify/qualify learning outcomes. I am pleased that there is a Mobile Dashboard, which allows students to see assessment results and complete quizzes. However, it is unlikely that the Mobile Dashboard accumulates data in the central repository. If Pearson’s data analytic tools integrated with mLearning applications, its value would increase. For instance, the Mobile Dashboard would make the learning outcomes of edugames more apparent if it integrated with such applications. The Mobile Dashboard does not do everything I hoped it could do, but it is a step in the right direction to advance mobile data analytics.
It would be helpful to see a demo of DreamBox or have a trial version to be able to provide a better review. At the moment, I could only go by what the company says about its product and from online reviews. It seems that DreamBox is interactive and tailored curriculum for K-8 (not high school math that I wanted to focus on). Games help students stay engaged and motivated, and the program itself could be customized for each child. Therefore, it could be used for classroom and home learning.
The updates are given about where the student is, what they are struggling with, and what they are good at, what lesson they are on, and at what grade level they are working at. DB is adaptive, non-linear, and provides appropriate scaffolding for the student. The graphics are quite simple, and from parents reviews, sometimes, the lesson instructions need improvement and the student might require additional assistance. DB teaches Math following Ontario Curriculum, in the context, and focuses on conceptual understanding.
In my opinion, DB could be used to compliment math learning at school and home. Again, this is just one way of delivery and students benefit from varied instruction as well. Just using one way of teaching Math might kill student motivation, the very exact quality DB claims to be their strength. To get a better picture of where the students are would require DB to be utilized on a regular basis, and I am not sure that this would work in my setting. Also, it seems that there isn’t any customization going on for teacher specific needs, and therefore no analytics would be available on teacher questioning methods that I was interested in the first place.
I chose to investigate Personalization & Adaptive Learning, specifically the Cognitive Tutor Software. I like that it targets math in grades 9-12, as I find a lot of software specializes toward elementary support. The course offerings are mostly algebra at different levels, but it does mention integrated math, but I have no idea what that means. The software is developed in the states so it must be an American thing. The product offers lesson review, vocabulary support and worked examples. Once the student is ready to put their skills to the test, they begin to work through an assigned question. If they get stuck, they can select “On-demand hints” which will help students from getting frustrated, or if they are working, but on the wrong track, the “just-in-time feedback” feature will point out the error and allow the student to make the correction themselves. This is one in real time, and this is where they would employ the analytics. I believe it’s this “just in time” feature that sets this software apart from any other tutoring course-ware, but I’m not sure it’s proprietary.
Integrated math is when different topics/subjects are weaved together in one course. As opposed to having a seperate course for each math subject (algebra, geometry, statistics, functions, calculus), as seen in high schools, an integrated Math course would cover all topics throughout the year in one course.
Thanks for your review!
For Activity #2 I decided to look at Trends Analysis & Prediction area and specifically looked at Course Signals. This application used by instructors and advisors sends messages to inspire and motivate students who are not using their class time wisely. I love the idea of using early intervention strategies to help students who maybe slipping and off track with their learning. As a guidance counsellor I often see students who are in jeopardy of failing due to the term being almost over, by that time it’s often too late. Having the ability to have students receive individual feedback maybe a motivating factor in making some changes to improve their performance. I see in my own educational context accessing instructor’s course signals and then making time to see these students for academic support and strategies to help the student be successful in their education.
I think the concept of the “green,yellow,red” colour system is also a little less threatening to students. In the program there is also a checklist for future success. While this might be general to the whole class, it can save time for the instructor instead of writing the same comments on multiple students papers. If a student still needs more help, then further face-to-face steps can be taken.
I chose Smart Sparrow simply out of interest. I hadn’t heard of it before and after watching a few of the videos on other products, Smart Sparrow was really interestaning and engaging. I like the idea of being able to tailor pathways of learning. This could be incredibly useful for teachers who have flipped classrooms. It feels like a ‘choose your own adventure’ book but with learning. The summary of which skills students had mastered is a great feature and the fact that simulations can be incorporated in to lessons is impressive. It seems as though it would be easy to identify which students need more help and with which concepts. It does integrate with other LMS’s and facilitates online collaboration and lesson sharing with other teachers in the community. It is impressive to see how many universities have adopted Smart Sparrow, although mostly in Australia where the product originates from, it will be one to watch as it expands in to the North American market. This is a product I would like to know more about.
Hi Coleen,
I also looked at Smart Sparrow. I found the site to be easy to navigate and very professional. It seems like it would be a great time saver for teachers. It would be great for my students to get individual feedback right away. Feedback is most effective when it comes in a timely manner, but teachers have more and more to do in the day. I would love to see this program in action.
I chose to look at D2L in greater depth. The school I was working for has been trying to get educators on board with its use but there seems to be a lag in the amount of training offered with how to use it. D2L has been around for quite some time. Desire2Learn provides a web-based suite of tools including tools for developing online courses, and tools for online delivery and course management. This innovative learning management system can be tailored to meet the needs of individual clients. Found it interesting that it is a Canadian company which is probably the likelihood of it being used in many Canadian school districts so far, ex. Calgary and Ontario. It has a user-friendly interface and fairly easy to navigate layout. You can upload a lot of content (MS Word files and PP and embed URLs, audio). I’m interested in the most the tools for tracking students progress such as assignments and grading, it offers a lot of assessment and evaluation tools. Can be used again for subsequent courses. Some weaknesses to it that I noticed is that one still needs a bit of training on how to use it and setting up each site or class takes some time and adaptability for an educator. Also, a new class set has to be initiated each time so you can not use the same materials again unless you share the content from a previous year without having to create another site all together for the new class. It offers a lot of collaboration tools students can use. Biggest concern would be digital citizenship and privacy since all class students share their emails, account information and school data within the site.
I chose Pearson, because I feel that it could help me in analyzing what the optimum instructional time is for my classes by analyzing student engagement in my classes. I am very interested in this question because in our district, all of our secondary schools have standardized on 80-minute classes which I feel is much too long, especially for a Grade 8 or Grade 9 class. But, in order to convince our board there would need to be hard data to convince them of that.
Many of our courses use Pearson textbooks, so for that reason as well, using Pearson’s analytics would be a natural fit.
Having the ability to match your Pearson textbooks with their program is a huge bonus. This program would definitely be able to help research your question about optimal instruction time. Through their online program you’d be able to chart how productive each student is at a particular time throughout the day.
If you didn’t have a Pearson textbook this might not be the best fit for you.
I also choose ASPIREDU, due to its PSE relevance of its Dropout Detective tool that assigns a single risk score to every student in online delivery allowing for more efficient outreach efforts. Furthermore, the Aspire Faculty Analytics tool collects and organizes assessment criteria and provides a comprehensive scorecard for each instructor. Using these cloud based tools, every PSE institution can improve an proactively control Student Retention, as well as Faculty Assessment, therefore timely addressing the students and “faculty fall-out, instructional concerns, and efficiently employing critical success factors for students and faculty.
Tableau offers and excellent platform for data analytics. I found it difficult to ascertain the actual features that could be utilized without signing up for a free trial, but it appears that Tableau focuses on data storage and representation. The application seems quite mobile, flexible and could be used for any business or educational institution to represent data. There do appear to be a number of options for collecting data as well, by importing it from other data apps (i.e. Google Analytics). Overall, it seems very comprehensive for organizations with large amounts of data.
Hi Angela,
I also explored Tableau, and you were right about how it was difficult to assess the specific features of the services that they provide. However, I like how they break down their solutions into ‘industries’, ‘departments’, ‘capabilities’ and ‘data environments’. It seems like they have many areas of a business/school covered, and can provide data analysis tailored to the needs of their clients. As a high school teacher, I am interested in Trend Analysis & Predication, as I hope to use the data analysis to find out areas that students are struggling with so I can come up with intervention strategies.
I looked at Smart Sparrow’s Adaptive eLearning Platform. I found it quite interesting and it does seem to tailor online learning for the individual student. The instructor uploads the content and sets pathways for students and as they move through the content they are directed along different pathways dependent upon how successful they are with the content. Those that are successful move ahead very quickly and those that struggle are moved through the content at a slower pace to enable them to be more successful with the content. Students that do not understand the content are redirected elsewhere to ensure they have the requisite skills to move through the content. This platform does seem to personalize learning through analytics but I am hesitant as it seems very pre-packaged. I believe that teaching and learning is more complex than these different pathways and this system also is only designed for online content and I’m not sure where the classroom teacher fits in. This is probably my own bias as this system combined with an instructor would probably be successful. The cost is also quite high and I’m not sure many institutions can afford the cost.
Chris
Course Signals:
I selected Course signals because I thought it was interesting and somewhat related to my first question. Course Signals is used in large classes and detects warning signs of students who are struggling or not using their time in class. The program then sends personalized messages to these students to motivate them. While it is not analyzing the formative assessment as my question asked, I think that this is a type of formal assessment as it lets students know how they are doing and encourages them to continue trying. This is a really neat and really useful application I would be interested to see what the feedback it provides entails and how accurate it is.
Sometimes it can be difficult to find a true fit for the question you are hoping to solve. This however highlights the potential of the market and opportunity for future designers. By using Course Signals it would be able to tell your students if they are on the right track with the practice quizzes they are taking. Perhaps it might not be used for a specific quiz, but a certain concept or topic instead.
I chose to look at D2L Brightspace, mostly because I have had some experience using D2L, both as a teacher and a student. D2L is a LMS which can be used to deliver online courses in any subject, much like Blackboard. Brightspace seems to be a new arm of D2L which is focused on online learning and adaptive programs to help the students focus on areas they need to improve. As a teacher administering a course this would be valuable for tailoring tasks for specific students in areas requiring extra study. It would also help students look at areas in which they need to improve and focus on them. I would be interested to see exactly how the program pinpoints the areas that students are struggling with and how it tailors the program to improve those areas for them.
Tableau is a ver interesting analytics tool that offer different options; desktop, server, or cloud. It runs on different OS and supports mobile devices. It has a new map design for geographical analysis
I decided to investigate Class Dojo. I like the fact that it is very flexible and allows the teacher to set up the program to track and give feedback on a wide range of activities and behaviors. Students create their own avatars and are given points for completing tasks or practicing positive behaviors. The teacher is able to pick which behaviors to reward and how to value student participation. With the amount of flexibility comes a lot of subjectivity. Teacher bias when recording student info seems unavoidable and the data collected may be used to influence classroom behavior but I can’t see the system producing any profound information from the subjective data. Patterns in behavior may come to light from reviewing class data but I also see some issues when measuring student engagement and behavior when relying on an external motivator. Does the data collected through Class Dojo highlight true behavior patterns, or just separate the students who have bought in to the games point system from those who haven’t?
One of the ways I used the data collected from Class Dojo this past year was to have the students analyze their own data and compare it to the class data in various ways. It was quite an eye opener for some of the students and it gave them real life experience in looking at data critically.
Of course with any data there is always going to be room for error. Bias is certainly a factor that can help contribute to a misrepresentation of the results. I also think you raise a good point about motivation. Some students will be highly motivated to receive “good behaviour” points while others could easily not be interested.
The benefit of the program though is that the behaviours are customizable. If you felt like one didn’t fit your class you could delete it. Alternatively if you felt like one was missing you can easily add it.
The program also doesn’t have to be just used for behaviours. It could be used in a variety of other ways. Anne has shared her experience with the program under Activity 3.
I chose to look at Cognitive Tudor. This Math software program, created by Carnegie Learning Inc., is designed for students in Grades 9-12. Courses available include Algebra, Geometry, and Integrated Math. This program includes personalized and adaptive technology to tailor instruction. Features include key terms, a glossary, step-by-step instruction, interactive examples, hints and immediate feedback. In many ways the program is similar to DreamBox Learning except this math tool targets Elementary students rather than High School. Although courses are listed, it is unclear where curricular objectives have been derived or who was involved in the development of the content of the program. In contrast, DreamBox Learning is linked to Math Standards in the United States and many provinces and territories in Canada. In terms of adaptive learning, both programs appear to offer a resource that can personalize instruction which benefits both students and teachers.
I was originally going to evaluate Panorama because surveys were mentioned in relation to my Activity 1 answers and I thought that a mix of qualitative and quantitative data would be needed. After visiting the Panorama site and using the search feature I couldn’t find anything about surveys and it was also very business oriented. I switched to the Pearson’s resource and discovered its analytic solution was for Pearson products only. Not surprising, and I’m guessing there would be a limited number of analytic solutions now based on a school or institution’s current LMS or CMS system in place? That shows perhaps a lot of room for new analytics venture solutions for this area! 😉
Anyway, I moved on to Course Signals simply as a point of interest because it really takes a great stance on formative feedback and motivation. Associated with Purdue university, it seems to take an informed rather than commercial approach, they seated the product in academic theory and educational scholarship (Chickering & Gamson’s 1991, Seven Principles for Good Practice in Undergraduate Education). I compared the description on that page to a framework I had made of their writing (located here: https://docs.google.com/spreadsheet/ccc?key=0Ahy3H3uKpFZMdHMzblZ4dzlVbTFyeUFxZ0htWElnbXc&usp=sharing). Clearly the solution supports some of these principles rather well (high expectations, increased student-teacher contact, prompt feedback & reciprocity). If I was developing a new analytic application solution, I’d think this is an excellent approach to consider! Formative feedback and assessment leaves room for course correction and this is really what this analytics venture capitalizes on. The venture promise is quite believable. I’m not sure how I feel about the red/yellow/green continuum for student feedback as this perhaps doesn’t offer enough information, then again sometimes simple is best. In a way this is analytics flipped on its head to be a simple student automated analytic feedback and teacher-student communication tool. Very interesting.
I think you’ve stumbled upon an interesting point of learning analytics. While its use is on the rise and there is market potential, there still is a gap between programs and your needs and finding the right fit for what data it is that you want to obtain and how you/the student is going to use it. To your benefit, I believe your variety of questions in your hypothesis from assignment 1 gave you the flexibility to be able to test out a variety of programs.
I feel your apprehension about CourseSignals and the use of red/yellow/green. As an educator it is a quick and easy way to provide feedback and I do appreciate that there is a list of items to encourage success in the course but I doubt that these items are personalized to each student. There is always the opportunity for a student to view a red or yellow colour and ask the teacher in person what it is that they can improve on, but not all students will take on this task by themselves. This program would be an easy way to show progress in our participation in MET classes. Sometimes its difficult to tell if we’re on track to obtain those marks.
Thank you for sharing the GoogleDocs on the variety of Frameworks. I checked out the Seven Principles and then looked at the other tabs. After learning so many different theories in this program its convenient to see them all in one place.
I chose to look at AspireEdu since the focus is on retention and early intervention for struggling students. While I can appreciate the idea of taking data collected by a LMS and creating a score similar to a credit rating that indicates if they are in trouble academically I think some of their claims are a bit far fetched. For example, “Depending on the LMS, it could take up to ten minutes to identify the last time that a student logged into the system, their grades in multiple courses, how many assignments they have failed to submit, and the last time that they submitted an assignment” (http://aspiredu.com/use-of-educational-analytics-for-retention-efforts-is-increasing-exponentially-2/). With most modern LMS it is very easy to find that information for each student. I currently use Desire2Learn and that information is very accessible, I can have a snapshot of student stability in a course very quickly. I guess the benefit of AspireEdu would be the ability to compile that across a number of courses for a large number of students.
I would be more interested in an analytics program that looks at different interventions taken to help struggling students and which were the most successful. It is reasonably easy to identify the students who are struggling but finding the best intervention or improvement to your online program is more challenging.
You’re welcome. Thanks for such a great activity! The exploration made it possible to identify the gaps and opportunities in the existing solutions, which is very valuable from a venture perspective. We’ve been innundated with so much information and so many frameworks that the running Gdoc was the most efficient way I could organize them or reference. I’m glad it proved useful. 🙂