In the US, sulphur dioxide (SO2) is a by-product from coal burning electricity production.
In fact, the largest sources are from fossil fuel combustion at power plants (73%) and other industrial facilities (20%), whereas smaller sources of SO2 emissions are due to industrial processes.
Policy’s Political Origin
The problem emersed in the 1980s due to American power plants sending up vast clouds of SO2, which then fell back to earth in the form of acid rain, damaging forests, lakes and buildings across US and eastern Canada. Many environmentalists were pushing federal officials requiring utility companies to install scrubbers to remove SO2 from their exhausts. By the end of the Reagan administration, Congress had rejected 70 different acid rain bills.
It was not until the 1988 election, when the president of the Environmental Defense Fund phoned Bush’s new White House counsel, Boyden Gray, to suggest that the best way for Bush to pledge as the “envrironmental president” was to fix the acid rain problem through the approach of the cap-and-trade system. Both EDF and the Bush White House felt that emissions trading would be the ideal way to address this problem, and the system was then implemented since the early 1990s as part of the 1990 Clean Air Act.
Goals
Since the early 1990s, the U.S. sulphur dioxide cap-and-trade system has been implemented with aims to reduce acid rain emissions from power plants. Under the Bush administration to curb major threats to the nation’s environment as well as to reduce acid rain levels, urban air pollution, and toxic air emissions, the SO2 cap-and-trade was established under the 1990 Clean Air Act Amendments.
The primary goal of this Act was to reduce the nation’s annual SO2 emissions by 10 million tons below its 1980 leves of 18.9 million tons. Through limitation of the overall aggregate SO2 emissions with this cap and trade system, it also had hopes to encourage innovation and to increase efficiency in the energy production industry.
Two Phases of the Policy Implementation
The policy sets a cap on the aggregate SO2 emissions within the U.S. electricity sector, and each permit of emissions was referred to as an “allowance”, where 1 allowance per ton of SO2 emissions was required. In order to achieve this goal, the policy was implemented in 2 phases. Phase 1 came into effect in 1995, affecting 263 units at coal-furning electric power plants across 21 eastern and mid-western states to cut their SO2 emission rates to 2.5lbs/mmBtu. New generating units built since 1978 had to limit their SO2 emissions to a lowest achievable rate of 0.6lbs/mmBtu. To provide a glimse on the magnitude, coal with 1.25% sulfur and 10,000 Btu/lb emits SO2 at 2.5lbs/mmBtu, with lower emissions produced by either lower sulfur content or higher Btu content.
Technology that was introduced during this period included the flue-gas desulfurization equipment, which aided in the reduction of SO2 emissions by 90%. The success of this in turn qualified those companies that installed this technology an extension of 2 additional years after the 1995 deadline, if they still own allowances to cover their emissions during the extension period.
Phase 2 began in 2000, tightening the annual limits of emissions imposed on large emitting plants, as well as introducing restrictions on smaller plants fired by coal, oil and gas, encompassing over a total of 200 units. All units units generating over 25 megawatts were required to limit emissions to 1.2 lbs/mmBtu by January, 2000, and were subject to a fine of $2000 for each ton emitted over their allowance, distributed as 8.95 million tons per year.
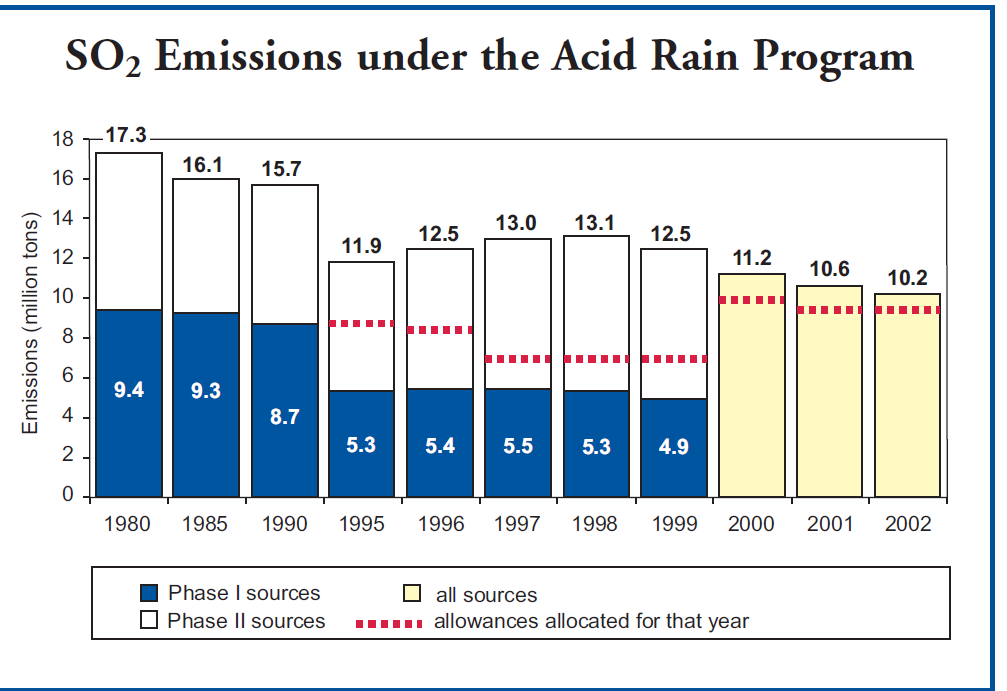
SO2 emissions have decreased 5.5 million tons from 1990 levels and more than 7 million tons from 1980. Source: Credit to EPA
Exemption
This system only applies to utilities and electricity generation in the States, and is not applicable to individual households that may be using coal furnaces for heat. Also, older plants were initially exempt from the program under the “grandfather” clause, with the assumption that they would shut down soon or undergo upgrade.
However, many of those that got upgraded did not install additional pollution controls as they were required, prompting lawsuits by the EPA against these older plants. Some of these lawsuits ended in billion dollar settlements with plants agreeing to pay penalties and to install the required controls.
Policy Implementation and Cost-Effectiveness
In the long-run, this program has delivered desirable results as SO2 emissions have been reduced faster and at lower costs than anticipated, yielding wide-ranging health and enrivonmental improvements. To be more specific, a study in 2003 by the Office of Management and Budget found that the SO2 cap and trade program accounted for the largest quantified human health benefits – over $70 billion annually- of any major federal regulatatory program implemented in the last 10 years. In other words, the benefit to cost ratio is over 40:1.
In 2002, SO2 emissions from power plants were 9% lower than in year 2000 and 41% lower than 1980. This in turn leads to better air quality by reducing human exposure to pollutants that are known to cause health effects. Ambient concentrations of SO2 have decreased by as much as 40% since 1990 in the Northeas and Mid-Atlantic.
Analyses from the Environmental Law Institute, Environmental Defense, and MIT’s Center for Energy and Environmental Policy Research have all examined emissions trading under this program to have found that the result of this policy has not resulted in geographic shifting of emissions due to trading. On the other hand, the highest emitting sources have tended to reduce emissions by the greatest amount. This may be due to the fact that trading occurs under a nationwide cap that represents a reduction in total emissions and improvements in regional air quality. On-going evaluation of local emission impacts under the cap and trade program is important.
Compliance with ths program has been consistently high (over 99%), due to stringent penalties which provide a strong incentive for compliance and require that any excess emissions are offset. The cost of compliance has been substantially lower than estimated. Achievement of the required SO2 emission reductions in 2010 is now projected to cost between 1 to 2 billion dollars annually, which is a mere quarter of the original EPA estimates.
Distributional Effects
There are independent power plants that do not have an allocation of SO2 allowances. Usually it is the largest firms that are receivers for the allowances, which typically further adds to their increasing profits. This then in turn gives the large firms an even greater boost in being competitive over the smaller firms. Thus, income distribution is not evenly distributed due to this program’s intervention. Also, smaller firms that struggle to adapt to the newer technologies and installations often suffer from this unbalanced distribution.
Concluding Thoughts
Undeniably, the cap and trade system for SO2 emissions in the States has been overall very successful in reducing aggregate emission levels at a lower than predicted cost. On top of that, it also motivates firms to embrace innovation and adapt to new technologies in the course of reducing emissions.
Since the firms receive these allowances for free, then the policy rents from the system is also received by these firms rather than the government. In other words, they receive a valuable asset with a market price attached to it. However, due to higher firm profits from these permits, these firms will also be taxed at the corporate level and personal level, which then a portion indirectly goes to the government. If these partial government revenues are used to reduce labour taxes, then this system will produce an indirect revenue-recycling effect as well.
References
1. http://dbp.idebate.org/en/index.php/Argument:_US_cap-and-trade_in_sulfur_dioxide_was_successful
2. http://www.epa.gov/airmarkets/trading/factsheet.html
3. https://docs.google.com/viewer?a=v&q=cache:_zjUVXxe-QQJ:www.rff.org/documents/rff-dp-03-46.pdf+&hl=en&gl=ca&pid=bl&srcid=ADGEESiYThRY61wBlaTxK4QkP8z7JGQbST7uY-8uci6XO9ClkLH36L_Id6kTi4GjHeKyzvo0hDlJzB6KcEnEqApL7o4YsGSC6Swq12WFaJq99-VTDExKLITMlDXnE9QSm_j1xqTA21U0&sig=AHIEtbQ-RRAjfnXns-GafEnrhLuItYtnsw
4. http://www.oecd.org/dataoecd/24/33/2105265.pdf
5. http://en.wikipedia.org/wiki/Acid_Rain_Program
Hey Lisa,
I’ve learned something new from your blog! Didn’t know that sulfur emissions also has a permit system analogous to BC’s approach to carbon emissions. In terms of Phase Two, when the regulations became more restrictive, was it still a tradable permit system or a standard imposed? Do you think it would have been a better social outcome if an emissions tax was imposed? If there are tax policy targetting on abatement, are there also subsidies implemented to encourage more technological innovations? Hope you won’t mind answering so many questions.
😉
Vicki