Kevin (Teng) Sun | MEL Clean Energy Engineering | December 4, 2024
Academic Mentor: Eric Mazzi, Professional Engineer, PhD, BC Hydro
Industrial Mentor: Norman Wild, Edinson Mahecha, Shantanav Bhowmick, BC Hydro
Abstract
This research evaluated behind-the-meter wind power for six large industrial facilities across British Columbia, using NREL’s System Advisor Model (SAM) coupled with the LandBOSSE cost model. Sites included mines, pulp mills, greenhouses and fish farms chosen for high demand and varied wind exposure. Hourly wind data and actual load profiles were used to size appropriate turbines and simulate 25-year cash flows (6% discount rate, 2.5% inflation). We found that only two sites: a remote mine (Site 1) and a coastal fish-farm cluster (Site 6), achieve positive NPVs under base assumptions. These succeed because of strong local winds, short grid connections and high local electricity rates. The other four sites showed NPVs of –$11M to –$47M, due to poor winds and low bill savings. Sensitivity runs indicate that very large production incentives (~$750/MWh) would be needed to make two marginal sites (Sites 2 & 4) break even, while Sites 3 & 5 remain uneconomic. We recommend advancing detailed feasibility studies at Sites 1 and 6 and revisiting Sites 2&4 under improved policy or pricing, to guide BC’s industrial decarbonization planning.
Introduction
British Columbia’s grid is mostly clean hydroelectricity, but demand is surging with economic growth and electrification. BC Hydro even plans rate increases and new supply to manage a coming “capacity crunch”. Industrial customers drive much of this load, and they seek on-site renewables to reduce costs and meet sustainability goals. Behind-the-meter wind could supply local power, avoiding transmission losses and diesel use at remote sites. In the U.S., studies suggest huge untapped potential for distributed wind on industrial loads. BC likewise has strong wind resource areas, especially in mountains and coastal straits. However, BC’s industrial electricity rates are low, which makes wind harder to justify purely on cost. Complex terrain, permitting issues, and the lack of existing BTM wind installations in BC further complicate feasibility. This study fills a knowledge gap by analyzing real site cases to see where on-site wind might work.

Figure 1: Standard Grid Connection vs Behind-the-Meter Wind

Figure 2: Site locations
Project Objectives
- Techno-economic modeling: Use SAM to simulate turbine outputs and economics at each site.
- Site comparison: Evaluate six representative industrial locations across BC.
- Sensitivity analysis: Test how changes in incentives, hub height, turbine count and discount rate affect project viability.
- Recommendations: Identify the most promising projects and advise developers/policymakers on how to unlock BTM wind in BC.
Methodology
Our approach combined data analysis with simulation modelling. We used hourly wind speeds from the NREL Wind Toolkit (Local Enhanced Data) for 2020 at the chosen site coordinates, adjusting to each turbine’s hub height via a standard wind-shear formula. Typical utility-scale turbines were assigned to each site: 1.8-3.0 MW Vestas machines (90-112 m rotors, ~100 m hub) for the mines and greenhouses, and a smaller 1.0 MW Mitsubishi MWT-1000 for the fish-farm site. We assumed 5% availability losses to allow for maintenance. Using SAM, we simulated hourly generation for one year and then annual production, with 0.5% annual degradation. All wind energy was assumed to offset on-site consumption, so no export was modelled.
Economics were calculated on a 25-year project life. Capital costs used a base turbine price plus site-specific balance-of-system costs from the NREL LandBOSSE model, which was calculated based on interconnection distance, interconnect voltage, labour multiplier, etc. O&M costs were estimated with industry benchmarks plus site factors such as remoteness and climate, so smaller/remote projects had higher $/kW·yr rates. A one-time production incentive of $150/MWh was included in base cases. Financial assumptions were: 6% real discount rate, 2.5% annual inflation, and Canadian income-tax and insurance rates as in SAM defaults. Key outputs were Net Present Value (NPV), Levelized Cost of Energy (LCOE), and payback periods.
Results & Discussion


Site 1(left), Site 2(middle), Site 3 (right)


Site 4(left), Site 5(middle), Site 6 (right)
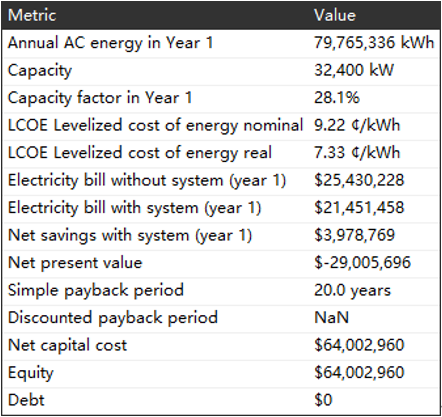
Table 1: Overview of the technology and economic results
Our six case-study sites are split into two groups. Only Site 1 and Site 6 achieved positive NPVs under the baseline assumptions. Site 1 has an exceptionally strong wind resource and is near its own substation, and Site 6 faces very high local electricity rates. Together, these factors yield favourable internal rates of return. All four other sites produced strongly negative NPVs in the base case. Their winds are weaker and the energy bill savings are smaller, so even large turbines can’t recoup costs.
In summary, Sites 1 and 6 succeed because wind resource quality and high tariff converge. The mine site enjoys >11 m/s winds, while the fish farm site benefits from offsetting expensive grid rates. The other sites either have only moderate winds or low commercial rates, so the cost of each kWh from the turbine greatly exceeds what the industrial user pays, destroying value. Our results highlight that in BC’s context of cheap power, on-site wind is only economically competitive where both resource and pricing are very favourable.
Parametric Sensitivity Analysis
We tested four key variables to see if marginal projects could become viable:
Production incentives


Site 1(left), Site 2(middle), Site 3 (right)


Site 4(left), Site 5(middle), Site 6 (right)
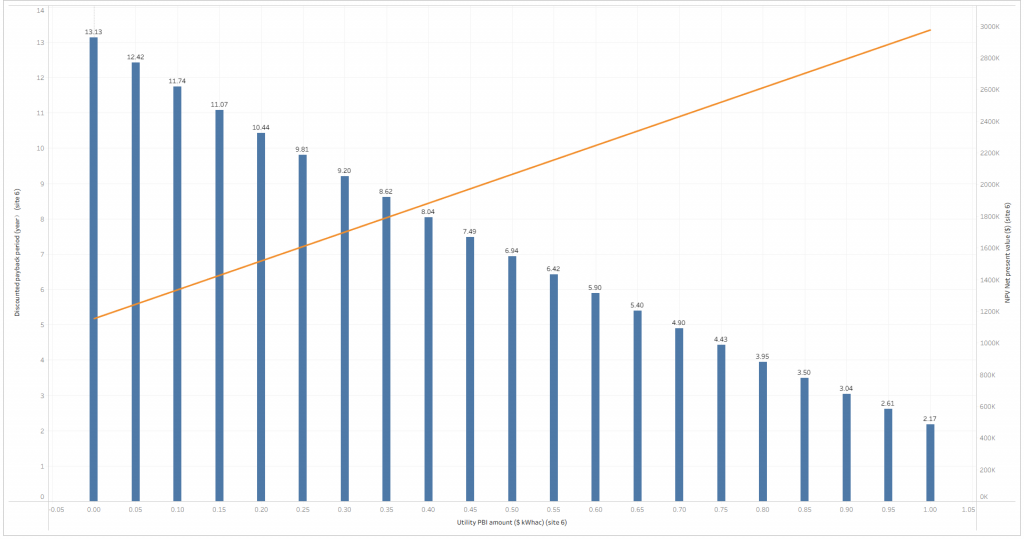
Figure 3: Discounted payback period (blue bar) and NPV (orange line) respond to varying incentive levels (0 to 1 $/kWh, in 0.05 increments) across all six project sites
Increasing the $/MWh incentive raises project NPVs almost linearly. Modest incentives ($150/MWh) make Site 1 barely positive and reinforced Site 6’s case. Sites 2 and 4 require very large incentives (~$750/MWh) to reach break-even, and Sites 3 and 5 show little change. In short, incentives help all projects, but only the inherently windy sites convert them into profitability.
Turbine hub height
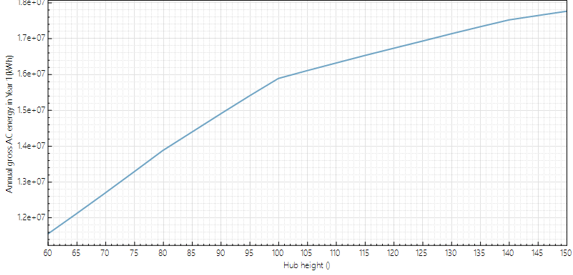
Site 1(left), Site 2(middle), Site 3 (right)
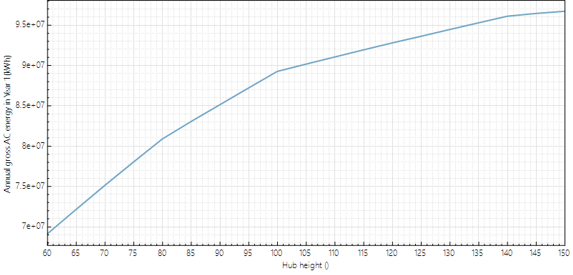
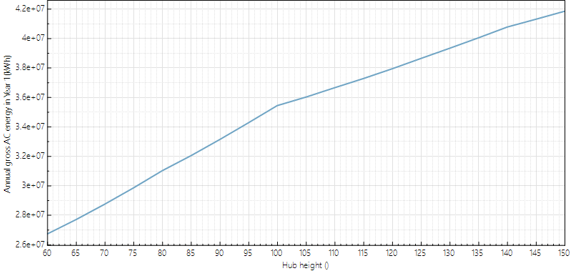

Site 4(left), Site 5(middle), Site 6 (right)
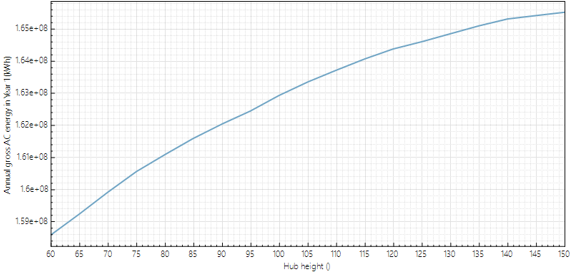
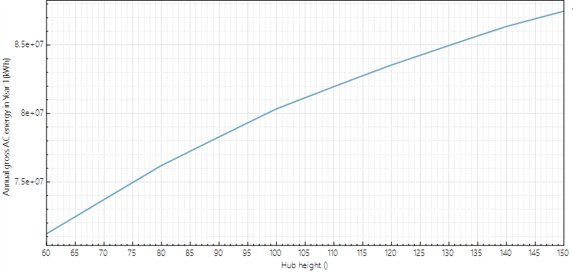
Figure 4: Annual energy generated responds to varying hub heights (60 to 150 m, in 5 m increments) across all six project sites
Taller towers increase energy yield. Raising hub height from 60 m up to about 100-120 m substantially boosts annual output at every site, due to higher average winds. However, gains diminish above 120 m. We found 100-110 m was an optimal balance at most sites. Beyond that, the extra tower cost outweighs the small energy gain. Crucially, even very tall towers cannot turn the weakest sites into money-makers.
Number of turbines
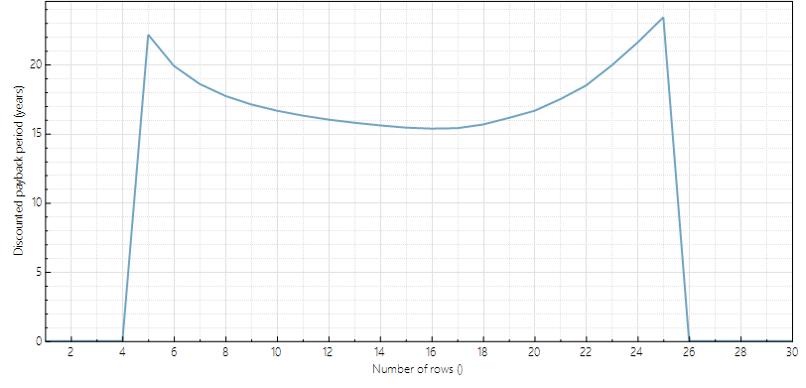

Discounted Payback Period responds to the number of turbines for site 1 (left) and site 6 (right)
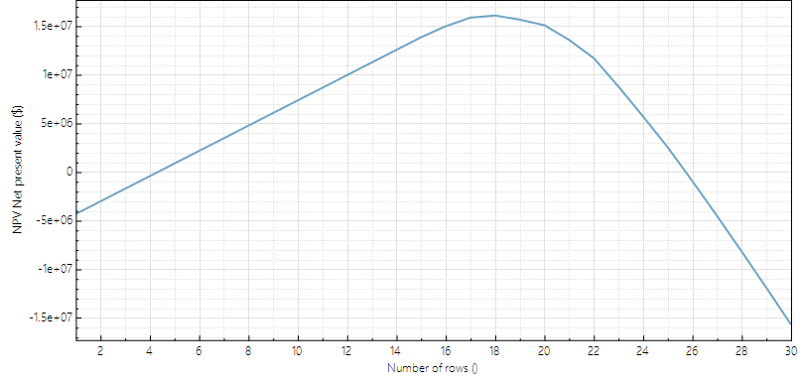
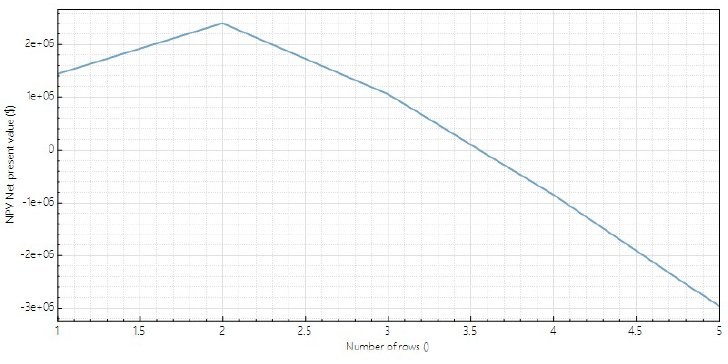
NPV responds to the number of turbines for site 1 (left) and site 6 (right)
Figure 5: Discounted Payback Period and NPV respond to varying numbers of turbines for sites 1 and 6
We varied project scale at Sites 1 and 6 because only these had a chance for positive NPV. Adding turbines initially raises NPV, but eventually extra turbines produce surplus energy that cannot be exported, so further additions cut into returns. For Site 1, NPV rose almost linearly with turbine count to 16-18, then peaked and declined. Site 6 showed the best NPV with 2 machines. Beyond that, the discounted payback period worsened.
Discount rate


Discounted Payback Period responds to discount rates for site 1 (left) and site 6 (right)
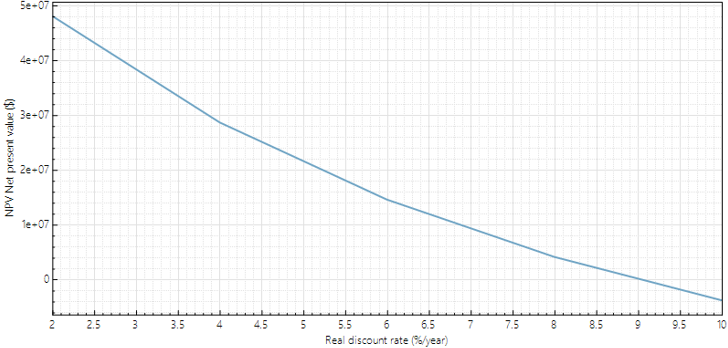

NPV responds to discount rates for site 1 (left) and site 6 (right)
Figure 6: Discounted Payback Period and NPV respond to varying discount rates for sites 1 and 6
A lower discount rate improves project economics. At 2-4% real rates, Sites 1 and 6 both have strong positive NPVs. As the rate climbs toward 8-10%, payback stretches and NPVs shrink. For example, Site 1 is near break-even at 8% discount and has no discounted payback at 10%. Site 6’s NPV declines more steadily with rate, remaining marginally positive at moderate rates but flipping negative at high rates. This shows the projects are sensitive to financing assumptions: only very low-cost capital (<6%) yields robust returns.
P10/P50/P90 Analysis

Site 1: P10/P50/P90 summary results

Site 6: P10/P50/P90 summary results
Table 2: P10/P50/P90 Summary Results for Site 1 and Site 6
Since only Sites 1 and 6 delivered positive NPV in the base-case SAM runs, the probabilistic analysis focuses on these two sites. To test robustness against inter-annual wind variability, we reran SAM using 20 years of hourly WIND Toolkit weather data (2000 to 2020) year by year. Years 2006 and 2012 were excluded due to clear anomalies, leaving 18 valid annual realizations per site.
For Site 1, annual energy variability is moderate: the P90 AEP is about 10% to 12% below the median, while capacity factor remains high. Financial results remain positive across all modeled years, with NPV around 12 M$ (P50), 14 M$ (P10), and still about 2 M$ (P90), indicating strong downside resilience.
For Site 6, inter-annual variability is also limited: P50 AEP is about 2.6 GWh, with 2.9 GWh (P10) and 2.4 GWh (P90), and NPVs stay positive throughout the distribution at roughly 1.35 M$ (P50) and 1.0 M$ (P90).
Risks and Limitations
Our findings come with several important findings. First, wind data uncertainty is significant. We relied on modelled wind speeds, not on-site measurements. If actual winds are lower than estimated, energy and savings will be overestimated. Site-specific met-tower or lidar data would be needed to firm up estimates. Financial assumptions also carry risk. Capital and O&M costs may differ from our benchmarks, and construction in difficult terrain could face overruns. Technical reliability is another concern. Turbine downtime, maintenance delays or extreme weather can cut expected output. On the regulatory side, permitting hurdles could delay or derail projects. For example, turbines near airports or sensitive areas may face objections. Future policy changes pose additional uncertainty. Finally, energy price volatility is key. We assumed static real tariffs, but if BC Hydro rates fall, the value of offset power shrinks, whereas higher rates or carbon taxes on diesel would make BTM wind more attractive. All these factors should be addressed by careful site assessment and stakeholder engagement before committing capital.
Conclusion
This study indicates that behind-the-meter wind can work at BC industries, but only at select locations. Under today’s costs and tariffs, Site 1 and Site 6 are economically feasible. We recommend advancing these two to detailed feasibility and wind monitoring. The remaining sites, by contrast, do not pay back in the base case. Sites 2 and 4 might be re-examined only if substantial incentives or grid price reforms materialize. These results highlight the two keys to viability: strong local winds and high on-site electricity costs. Policymakers and utilities can take note: modest production incentives, demand-charge credits, or export opportunities could tip marginal sites into feasibility. More broadly, our findings help guide BC’s industrial energy self-generation by showing where on-site wind generation is most promising.
References
- Draxl, C., B.M. Hodge, A. Clifton, and J. McCaa. 2015. Overview and Meteorological Validation of the Wind Integration National Dataset Toolkit (Technical Report, NREL/TP-5000-61740). Golden, CO: National Renewable Energy Laboratory.
- Draxl, C., B.M. Hodge, A. Clifton, and J. McCaa. 2015. “The Wind Integration National Dataset (WIND) Toolkit.” Applied Energy 151: 355366.
- King, J., A. Clifton, and B.M. Hodge. 2014. Validation of Power Output for the WIND Toolkit (Technical Report, NREL/TP-5D00-61714). Golden, CO: National Renewable Energy Laboratory.
- Lantz, E., Sigrin, B., Preus, R., Baring-Gould, E., & Gleason, M. (2016). Assessing the future of distributed wind: Opportunities for behind-the-meter projects (NREL Report No. NREL/TP-6A20-67337). National Renewable Energy Laboratory. https://doi.org/10.2172/1333625
- Barrows, S. E., Homer, J. S., & Orrell, A. C. (2021). Valuing wind as a distributed energy resource: A literature review. Renewable and Sustainable Energy Reviews, 152, 111678. https://doi.org/10.1016/j.rser.2021.111678
- Reilly, J., Poudel, R., Krishnan, V., Anderson, B., Rane, J., Baring-Gould, I., & Clark, C. (2022). Hybrid distributed wind and battery energy storage systems (NREL Report No. NREL/TP-5000-77662). National Renewable Energy Laboratory. https://doi.org/10.2172/1874259
- Sheridan, L. M., Kazimierczuk, K., Garbe, J. T., & Preziuso, D. C. (2024). Distributed wind market report: 2024 edition (PNNL-36057). Pacific Northwest National Laboratory. https://doi.org/10.2172/2428926
- BC Hydro. (2021). 2021 integrated resource plan. BC Hydro. https://www.bchydro.com/content/dam/BCHydro/customer-portal/documents/corporate/regulatory-planning-documents/integrated-resource-plans/current-plan/integrated-resource-plan-2021.pdf
- BC Ministry of Energy, Mines and Low Carbon Innovation. (n.d.). British Columbia wind data and atlas
- Simard, S., et al. (2017). Wind power opportunities for remote mine sites in the Canadian North. Renewable Energy and Power Quality Journal, 15.
Contact
Kevin (Teng) Sun, MEL Clean Energy Engineering (CEEN), UBC 2025
Email: futureteng1996@gmail.com
LinkedIn: www.linkedin.com/in/tengsun-23333