Toronto, Ontario contains 140 neighbourhoods, 12 hospitals, and 231 mental health and addiction organizations (Map 1). Of these 243 resource facilities across Toronto many are concentrated in just a few neighbourhoods. Notably, most resource faculties are clustered downtown, where as on the east side of Toronto they are very sparsely found (Map 2). As a result, in the event of a mental health or addiction emergency people residing on the east side of the city have limited options for seeking immediate help. Hospitals are farther away for urgent issues, and supportive organizations are few and far between.
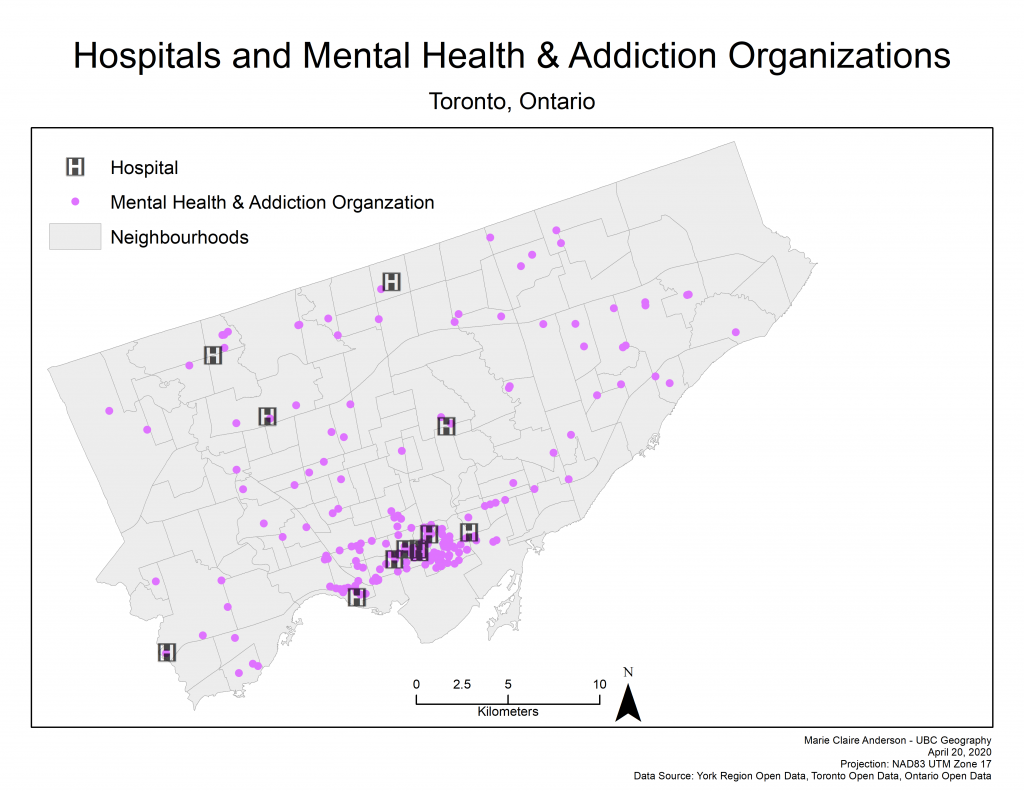
Map 1: Hospital and Mental Health and Addiction Organization locations
Map 2: Number of resource facilities by neighbourhood
Additionally, it is seen that there are many densely populated neighbourhoods in the eastern portion of the city where mental health and addiction organizations and hospitals are sparse or non-existent. (Map 3). This uneven population to facility distribution has the potential to be problematic when mental health issues or emergencies begin to arise in these areas. Due to high populations, many of these eastern neighbourhoods do not have the resources they need to support the mental health needs of the population.
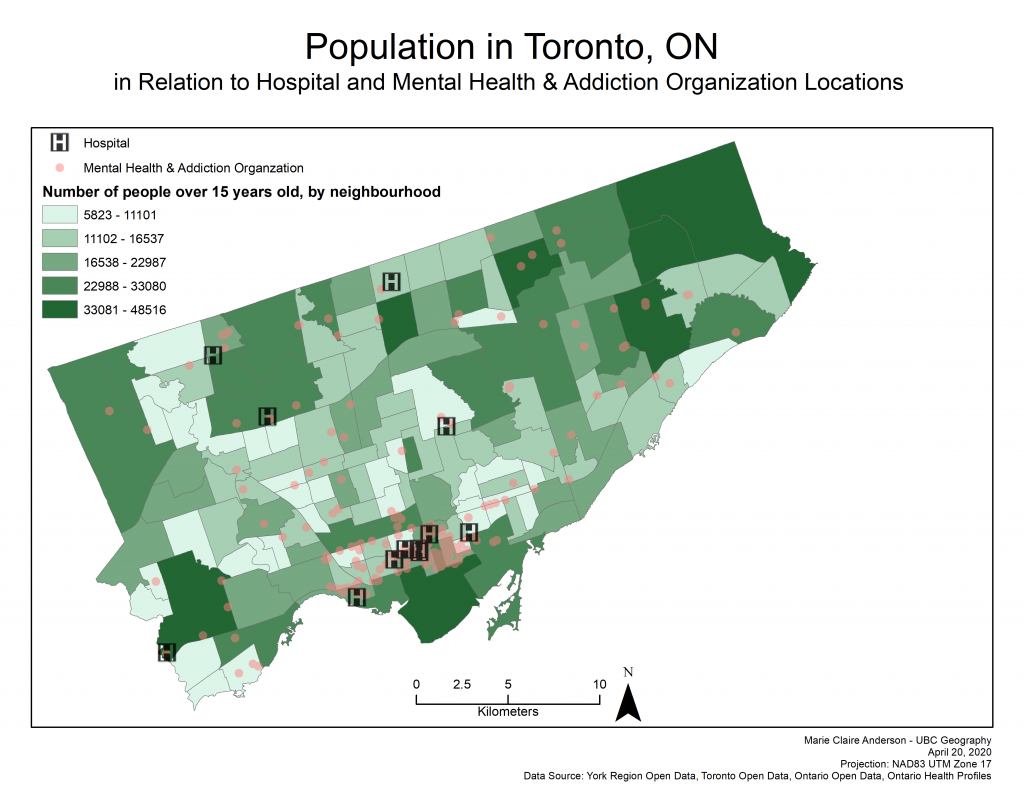
Map 3: Population over 15 years old and service locations
Correlation Analysis & Exploratory
Through conducting correlation analysis on the two dependant variables (Mental Health and Addiction Hospitalizations & Mental Health and Addiction Emergency Department Visits) and the 11 explanatory variables – results proved to show that in the cases of both dependant variables, 6 explanatory variables did not yield statistically significant PPMC values (Figure 1). These 6 variables were single families, deprivation, dependancy, ethnic concentration, debt risk, and home prices.
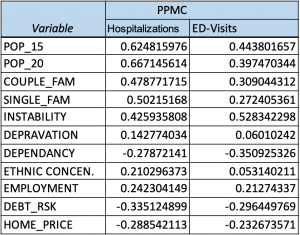
Figure 1: Independant variable PPMC values
Exploratory regressions on both dependant variables determined that the same six variables did not have relationships significant enough to include in regression analysis. Leaving population over the age of 15, population over the age of 20, coupled families, instability, and employment as the five remaining significant variables to be investigated. Of these remaining variables, deprivation and employment have the weakest relationships.
Ordinary Least Squares Regressions & Moran’s I
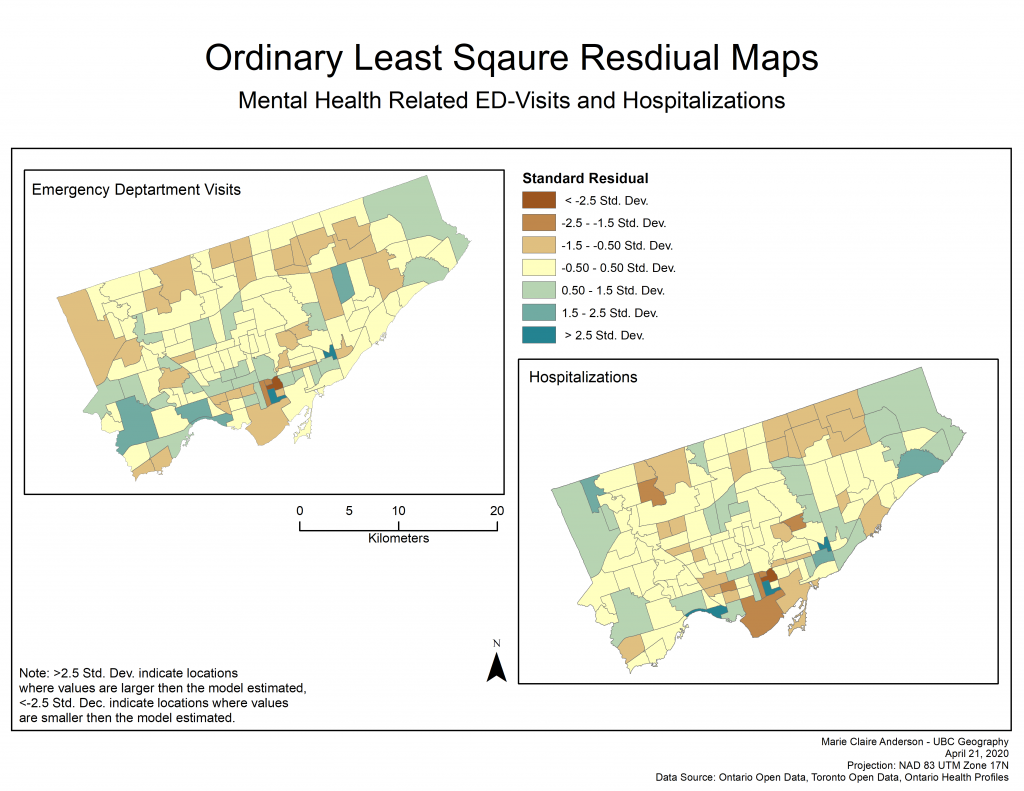
Map 4: OLS residuals
The OLS results revealed similar results for both dependant variables (Map 4, Figure 2, Figure 3). The neighbourhoods which make up the downtown core of Toronto, based off the standard residuals, indicated that values were smaller than the model estimated. Other areas that displayed this same result are scattered throughout the city but notably in the neighbourhood ID’s of 27, 22, 44, 55, and 129 (see Data tab for neighbourhood ID references).
To test the if there was any significant clustering of the OLS residuals, spatial autocorellation was conducted on them. For mental health and addiction related hospitalizations the spatial autocorrelation of the residuals produced a Moran’s I value of 0.018020, and for mental health and addiction related emergency department visits the spatial autocorrelation of the residuals produced a Moran’s I value of -0.032611. Both of these Moran’s I values indicate that the residuals are spatially random. As such, it is inferred that there is not a significant explanatory variable that is missing from the analysis.
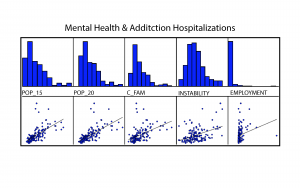
Figure 2: OLS report yielded histograms and scatterplots (Hospitalizations)
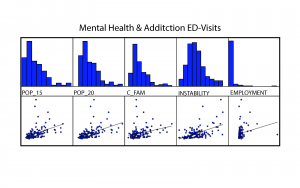
Figure 3: OLS report yielded histograms and scatterplots (ED-Visits)
Geographically Weighted Regressions
Geographically Weighted Regression analysis on the two dependant variables with the same five explanatory variables for each – generated similar local r-squared results. Similar results in that mostly the same neighbourhoods yielded high r-squared values (Map 5). The dissimilar neighbourhoods (lighter green) with smaller r-square values indicate neighbourhoods where the model does not explain the variation in the dependant variable around it’s mean. This suggests that the model did not fit the neighbourhoods with very low r-sqaured values very well. In contrast, the neighbourhoods with high r-squared values indicate that the model explains the variation in these areas well. As the majority of the neighbourhoods have very high r-squared values it can be deduced that these GWR regression models fit well in most neighbourhoods throughout Toronto.
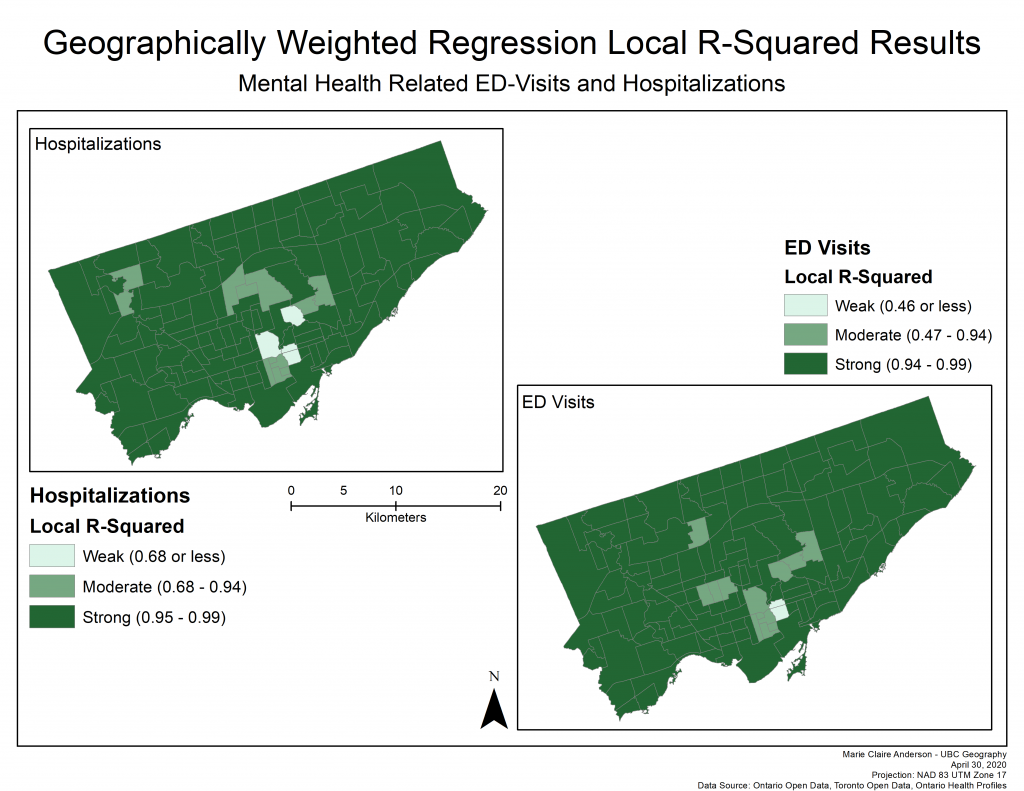
Map 5: GWR Results
Additionally, each GWR produced co-efficient raster surfaces for each of the five explanatory variables.
Explanatory Variable: Population over 15 years old
Map 6: Coefficient surfaces for mental health & addictions patient occurrences and population over 15 years old
The results from these coefficient raster surfaces indicate that the population over 15 years old has a strong positive coefficient across most of Toronto when considering both mental health and addiction hospitalizations and emergency department visits (Map 6). With a notable strong negative coefficient seen in the Birchcliffe-Cliffside neighbourhood and those immediately sounding it – in addition to West Humber Clairville. This result is expected in that areas of the city with higher populations have a stronger positive relationship with mental health and addiction patient occurrences, simply because more people means more incidents. The very strong positive coefficient values in the Downtown area potentially point towards the presence of more people living informally (on the street or in a shelter) as informal living is often associated with poor mental health and addiction.
Explanatory Variable: Population over 20 years old
Map 7: Coefficient surfaces for mental health & addictions patient occurrences and population over 20 years old
The results shown on these coefficient raster surfaces indicate almost a complete contrast to the population over the age of 15 coefficient surfaces (Map 7). With strong positive coefficient values in Birchcliffe-Cliffside, West Humber Clairville and their immediate neighbours and moderate coefficient values dominating the city. The difference between these coefficient surfaces and those of the population over 15 years old, suggests that perhaps mental health and addiction related hospitalizations and ED-visits are, overall, occurring more often in people between the ages of 15 and 20.
Explanatory Variable: Coupled Families
Map 8: Coefficient surfaces for mental health & addictions patient occurrences and coupled families
The results depicted on these two coefficient surfaces again, are very similar. Strong positive coefficient values are seen in Birchcliffe-Cliffside, Cabbagetown-South Street James Town, North St. James Town and their close surrounding areas (Map 8). Additionally, slightly positive coefficient values are notable in the north-west area of the city on the hospitalizations surface and strong negative coefficient values are notable in the mid-east areas of the city and downtown. The strong positive coefficients in the central Downtown areas and Birchcliffe-Cliffside may infer that these areas have higher rates of people in unhappy relationships, as toxic relationships have the potential to bring about poor mental health and reliance on substances which can, in turn, lead to hospitalizations and ED-visits. Likewise, neighbourhoods with strong positive coefficients may signify higher rates of domestic violence, as domestic violence can have significant mental health consequences (Humphreys and Thiara, 2003).
Explanatory Variable: Instability
Map 9: Coefficient surfaces for mental health & addictions patient occurrences and instability
Unlike with the results of previous explanatory variables, the surfaces for hospitalizations and ED-visits are quite different (Map 9). Strong positive coefficient values are notable across the northern half of the city for the hospitalization surface, unlike the ED-visits surface which has notably weaker coefficient values across the entire city. Birchcliffe-Cliffside and the downtown areas, on both surfaces, are exhibiting similar strong positive values. Instability scores, are determined by “area-level concentrations of people who experience high rates of family or housing instability” (Matheson FI, 2016; p. 7). As such areas with strong positive coefficient values, indicates that mental health emergencies may be happening as a result of an unstable atmosphere. In the Downtown area that is exhibiting the strong positive coefficient values, as noted earlier in reference to populations over 15 years old, this relationship is likely so strong due to the probable surge of informal occupants in this area.
Explanatory Variable: Employment
Map 10: Coefficient surfaces for mental health & addictions patient occurrences and employment
These two surfaces are exhibiting positive coefficient values across most of the city and extremely negative coefficient values in Birchcliffe-Cliffside, throughout the and west of the middle of the city, and in and around West Humber Clairville (Map 10). The strong positive coefficient values around the Downtown, Etobicoke and and North York regions (which include several neighbourhoods within) indicates perhaps that there is something job related causing poor mental health. This is due to the fact that areas with higher frequencies of employed residents are displaying a strong relationship with mental health emergencies. The areas with negative coefficient values lead to further questions, such as: do these neighbourhoods have enough employment opportunities for those with mental health limitations? As employment opportunities can be challenging to find for those with mental health limitations (Marwaha et al., 2014).
Network Analysis
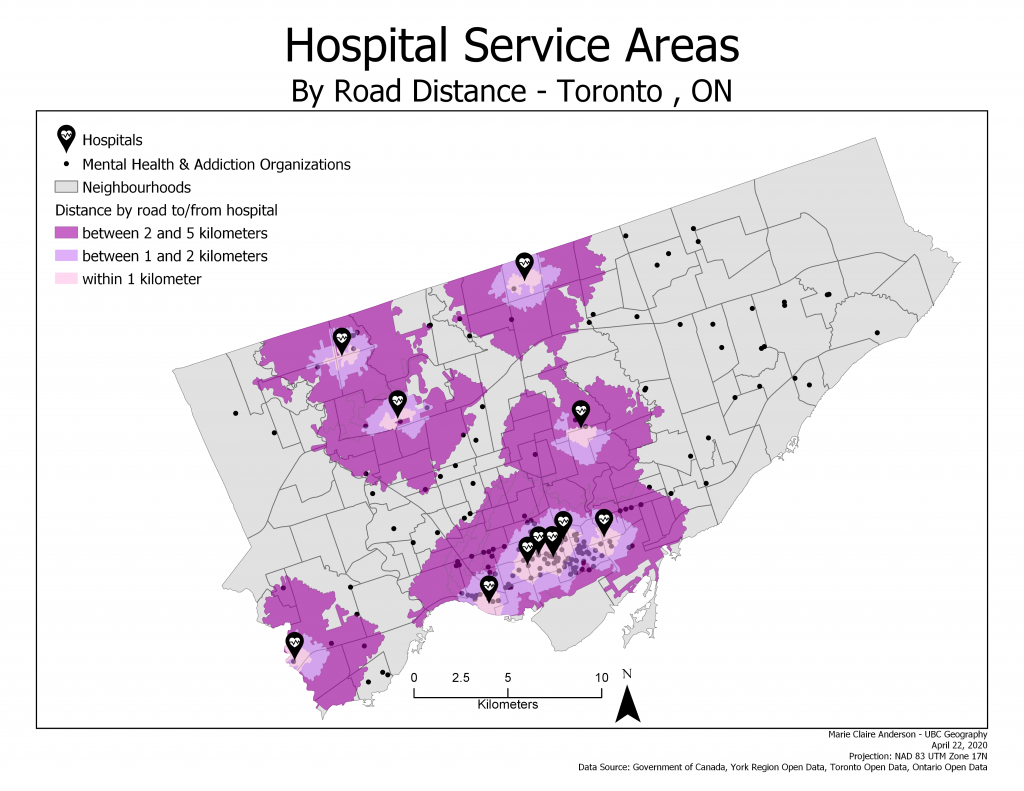
Map 11: Hospital service areas
The network analysis of the hospital service areas proved to show that much of the city is not within a quick driving or walking distance to a hospital. Notably, the entire east side of the city has limited mental health and addiction related organizations and no close hospitals.