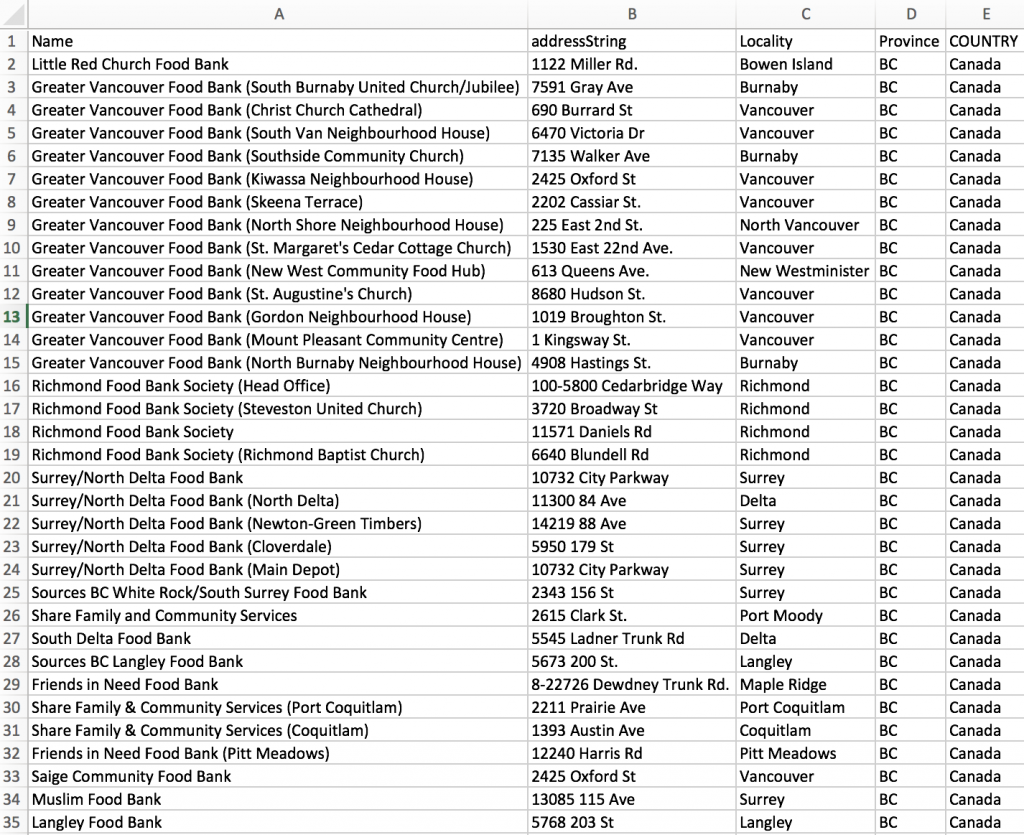
Before beginning to build any maps, current food bank location data had to be acquired as there was no single list collecting all food bank distribution locations in Metro Vancouver. Food bank locations were found via Google search by searching “‘municipality name’ + food bank” and then this data was collected in an Excel spreadsheet. The data was then geocoded using the Geocoder Address List Editor. The geocoded data was then added to ArcMap.
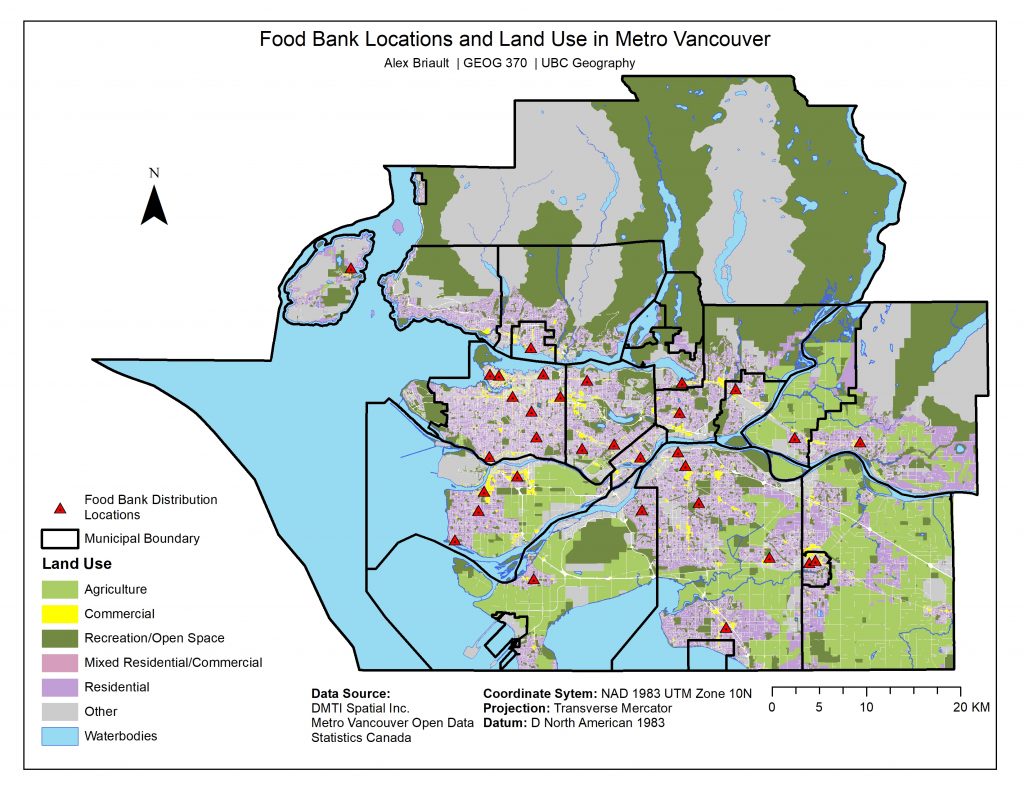
Municipality boundaries and land use category data from Metro Vancouver was added to ArcMap. Land use categories were condensed into six categories: agriculture, commercial, recreation/open space, mixed residential/commercial, residential, other, and waterbodies. The other category included all land use categories that would be unsuitable for a food bank such as: airport, cemeteries, protected watersheds, industrial, undeveloped land, Port Metro Vancouver, utility, and rail/rapid transit. The land use categories were then assigned costs favouring residential, mixed residential/commercial, and commercial land while agriculture, recreation/open space, other, and waterbodies were all assigned prohibitively high costs to prevent those areas being identified as potential future sites.
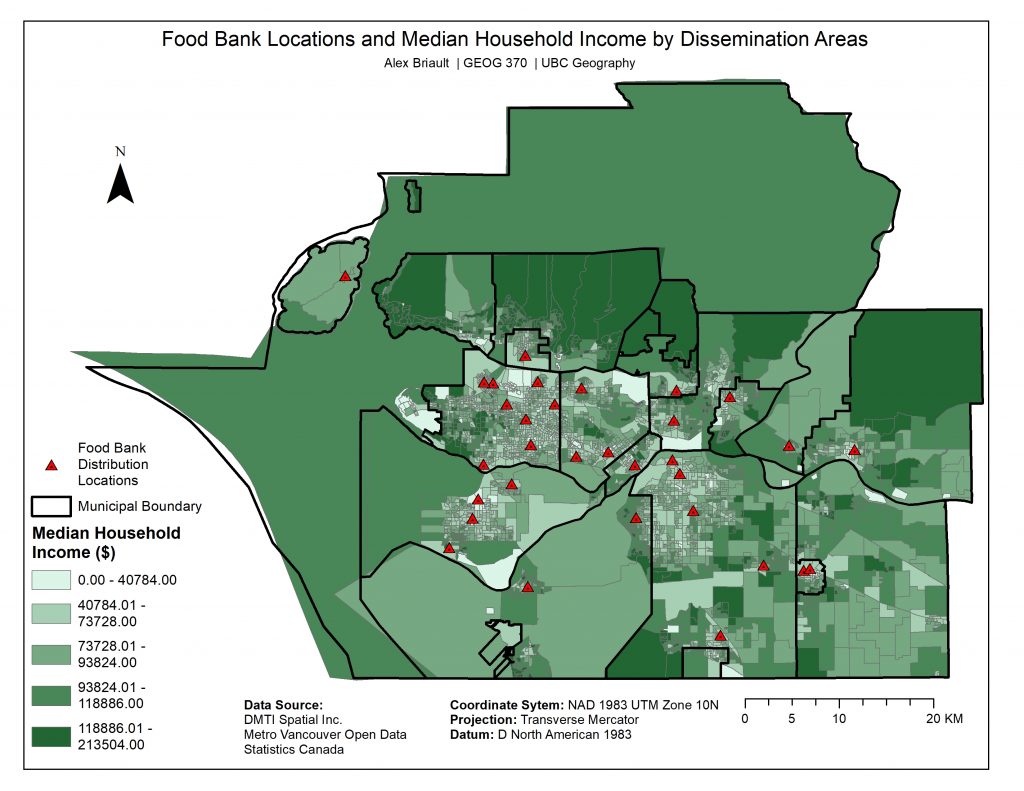
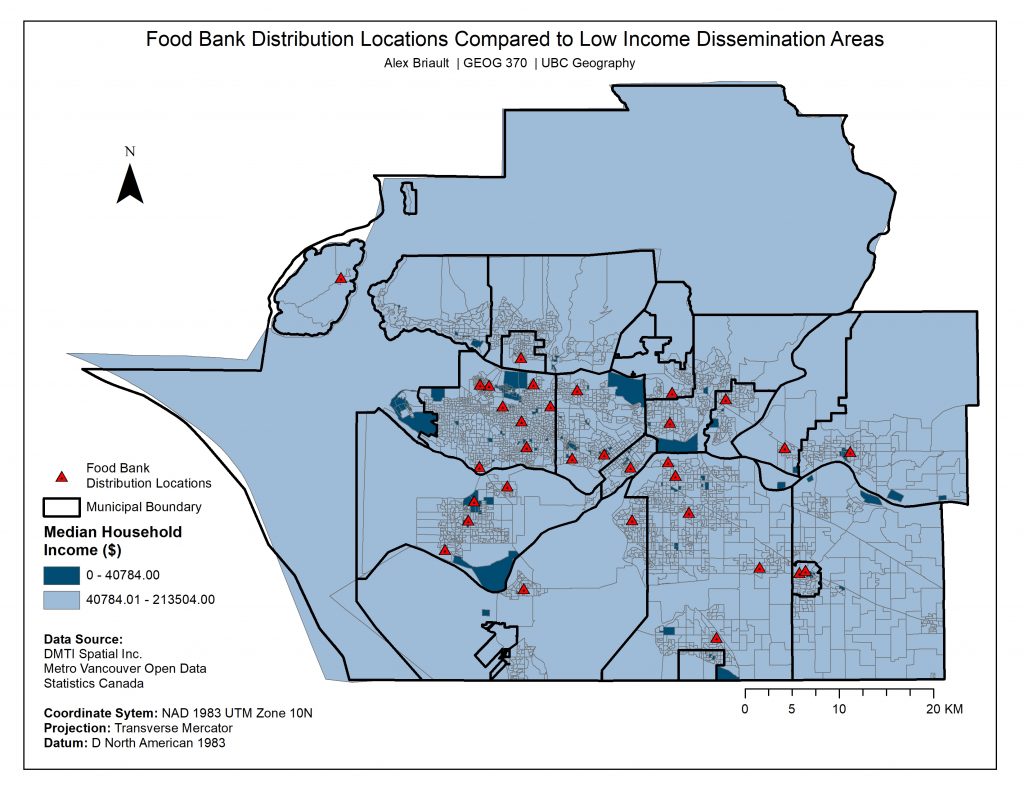
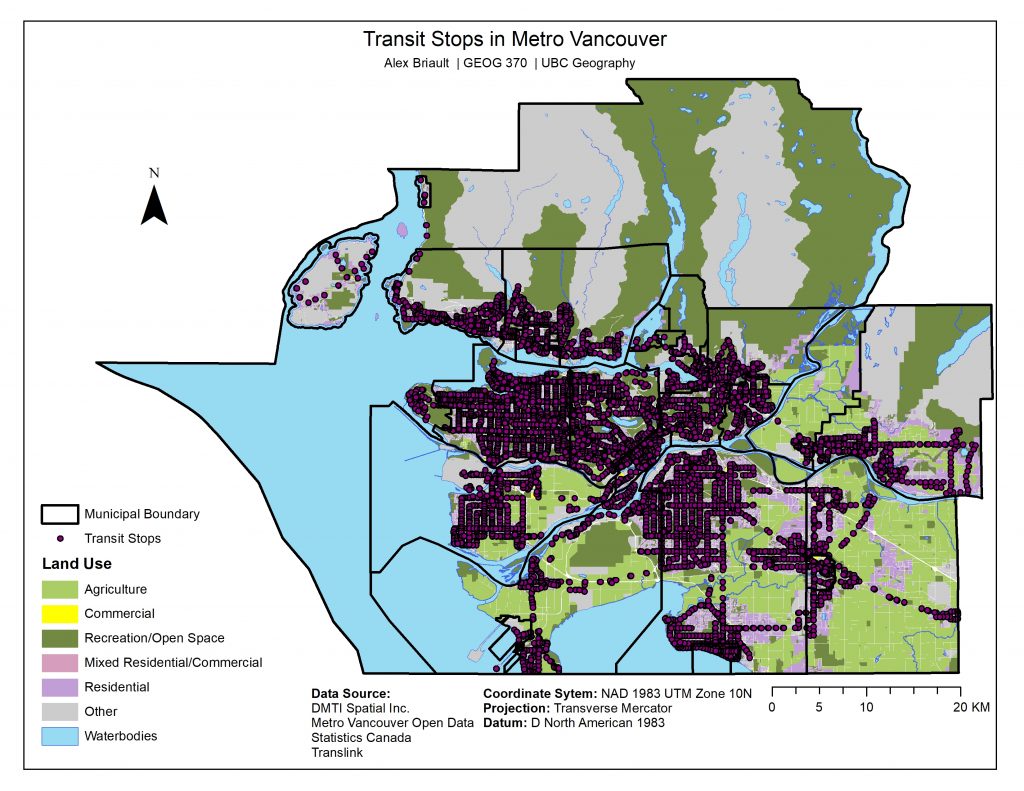
Dissemination Area (DA) data for median household income was added to ArcMap and clipped to the Municipal Boundary layer. Median Income data was reclassified to highlight low income DAs and this was determined by calculating 50% of the mean income similarly to the low income measure. Transit stop locations were added to ArcMap and clipped to the Municipal Boundary layer to exclude stops outside the Metro Vancouver area.
