Riparian areas are essential to the subsistence of aquatic life, wildlife corridors, and biodiversity within the landscapes that they course. These areas are best described as the narrow regions of convergence between terrestrial and freshwater ecosystems, such as streams, lakes, and wetlands.
The vegetation which inhabits riparian areas play a crucial role in influencing the processes of their neighbouring freshwater environments. For streams in particular, this riparian vegetation regulates processes such as water quality, flow regimes, and temperature, as well as sedimentary processes.
While many scientific studies have explored the use of remote sensing applications to explain riparian vegetation characteristics, very few have attempted to classify this vegetation. Much of this has to do with the relatively-recent advancements of fine-scale RS data acquisition, and increasing trends in affordability of remotely sensed data acquisition. These changes have opened the door for more research into the classification of riparian vegetation, as it is still an emerging field with relatively few groups investigating this process, and none doing so within the Okanagan Basin.
My research will attempt to address the following goals:
- To classify different zones of riparian vegetation of fish-bearing streams within the Okanagan Basin, through the use of remote sensing applications, and
- To utilize riparian vegetation classifications to investigate relationships between riparian vegetation and stream surface temperature, for specific streams within the Okanagan Basin.
For the first goal of my research, I will be focusing on riparian areas of fish-bearing streams within the Okanagan Basin (Figure 1, coloured watersheds).
For the second goal of my research, limited streams have been identified for potential selection, due to field data acquisition constraints (Figure 1, hatch-filled watersheds). These streams are based on management priorities of the Okanagan Nation Alliance, as well as conservation efforts towards Kokanee and Chinook salmon habitat.
In order to reach these goals, I plan to utilize LiDAR, spectral, thermal, and temperature pendant datasets to spatially analyze these riparian processes.
A LiDAR tile within the Okanagan Basin is supplied below, and shows examples of a digital elevation model (DEM) and and a canopy height model (CHM) raster tile (Figure 2). These are examples of products that can be created from an aerial-acquired LiDAR point-cloud.
The hope is that once this project has been completed, future research can be done to further assess riparian-based characteristics within the Okanagan basin.
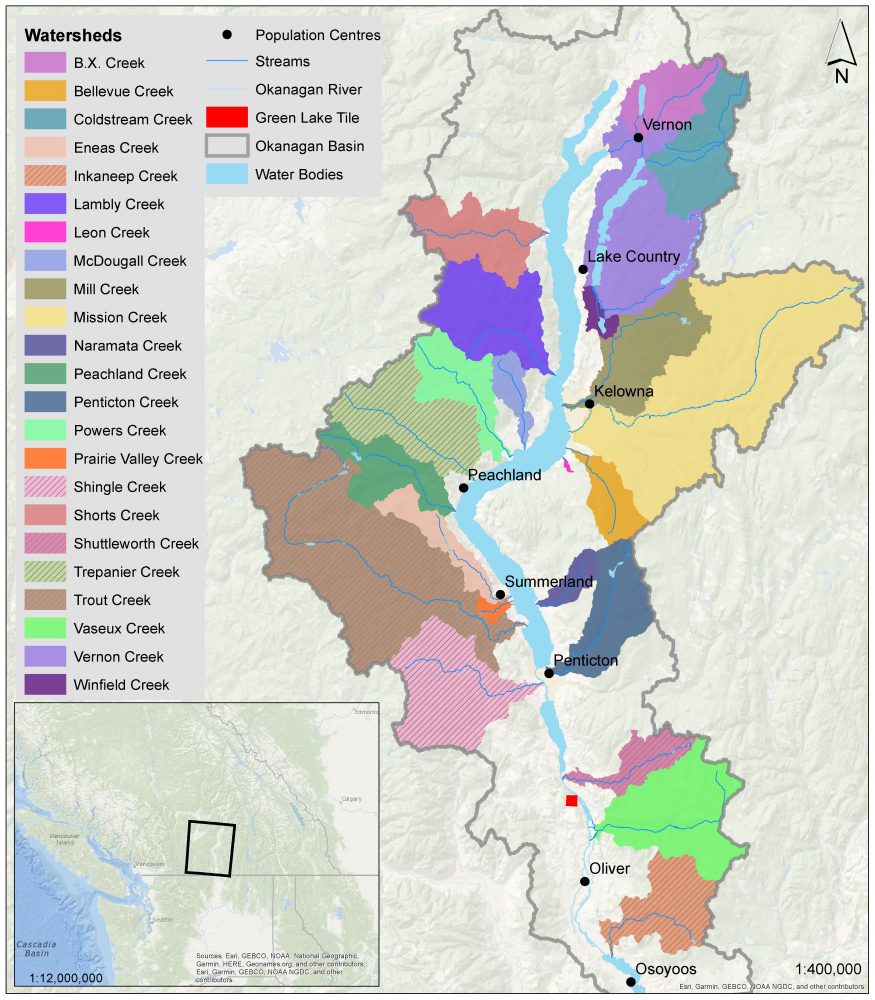
Figure 1. This map of the study area shows fish-bearing streams of the Okanagan Basin, described through attributing colours to their watersheds (polygons). Watersheds which also have a hatched fill denote streams which may be chosen for further investigation, through the second goal of this research. The red tile just north of Oliver, BC is displayed to give spatial reference to the plots shown in Figure 2.
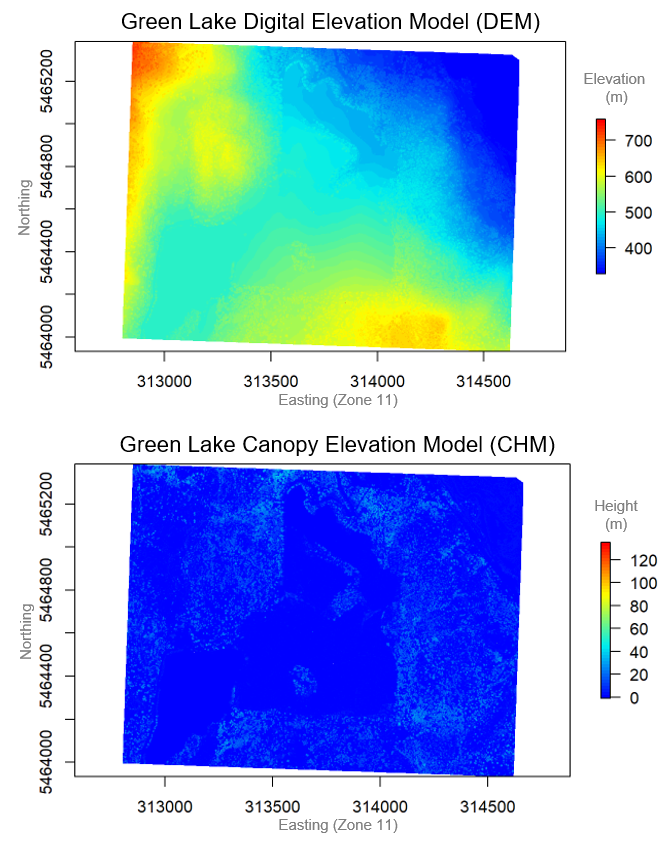
Figure 2. These plots, generated in RStudio, show DEM and CHM generated surfaces. A DEM essentially shows the height of all of the objects on the landscape which are directly visible to a sensor above it (i.e. open areas of terrain, tree canopies, building roofs, etc.). The values of each pixel correspond to metres above sea level. A CHM shows the height at which objects are above the terrain. The values of each pixel correspond to the maximum height (sometimes averaged from a particular proportion of the heightest returns) from the ground surface at that pixel. These surfaces both explain the area surrounding Green Lake, in the southern Okanagan Basin (red tile, Figure 1).