Question 5:
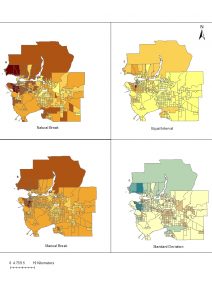
As a journalist, I would use manual break. Vancouver has many extremes in terms of housing cost. By using manual break classification method, I will be able to adjust the width of each class so that each class is represented as accurate as possible. However, since the classes are manually determined, bias will exist in terms of where to break off each class. However, if I’m a real estate agent for potential UBC buyers, I will use equal interval or standard deviation method because these two methods will all result in a lower housing price shown on the UBC tract. Equal interval method will provide a map that is easier for audiences’ understanding. There are ethical issues when choosing the classification methods to use because each method can show a biased map that is emphasizes on different aspects of the data. When preparing the map, I should also not that the source data is outdated and be aware of any change that may occur after the current data is being released.
Question 9:
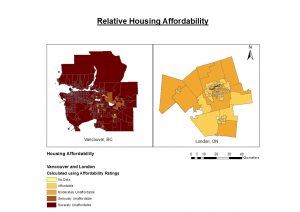
Affordability Measuring is the ratio between median housing cost and median household income. It is a good indicator because it considers both the housing price of a city and its citizens income level. It is a more comprehensive way of showing affordability.
Affordability Rating: determined by many countries using the affordability measure ratios, and it cannot be easily trusted as each city has its own housing situation and needs to be considered on a case-by-case scenario. Affordability is only one aspect of livability. Other aspects can include the greenness of the city, its culture, its attractions, its services provided, its climate, etc.
0-3 Affordable
3-4 Moderately Unaffordable
4-5 Seriously Unaffordable
5 and above Severely Unaffordable